Introduction
Most people trust charts without questioning them – but many graphs are actually misleading.
Data visualization mistakes are everywhere. From news articles to business reports, charts are often presented as objective truth. But in reality, many visuals distort data and mislead readers. Understanding how charts can mislead is essential if you want to interpret information correctly.
Understanding how charts can mislead is essential if you want to interpret data correctly and avoid common visualization errors.
Understanding how visuals influence perception is essential. Research from Nielsen Norman Group explains how users interpret visual information and why charts can be misleading.
Data Visualization Mistakes: Why Charts Can Be Misleading
Data visualizations are powerful because they simplify complex information. However, this power also makes them dangerous.
Even small visualization errors can distort trends and exaggerate differences.
That’s why recognizing misleading charts is a critical skill.
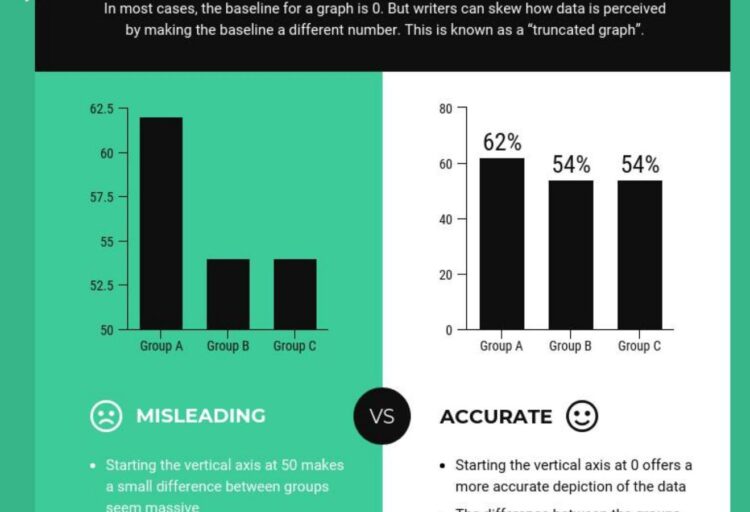
1. Truncated Y-Axis (One of the Worst Data Visualization Mistakes)
One of the most common chart issues is cutting the y-axis.
By not starting at zero, small differences appear massive. This technique is frequently used in media and marketing.
👉 Result: the viewer perceives a dramatic change that doesn’t actually exist.
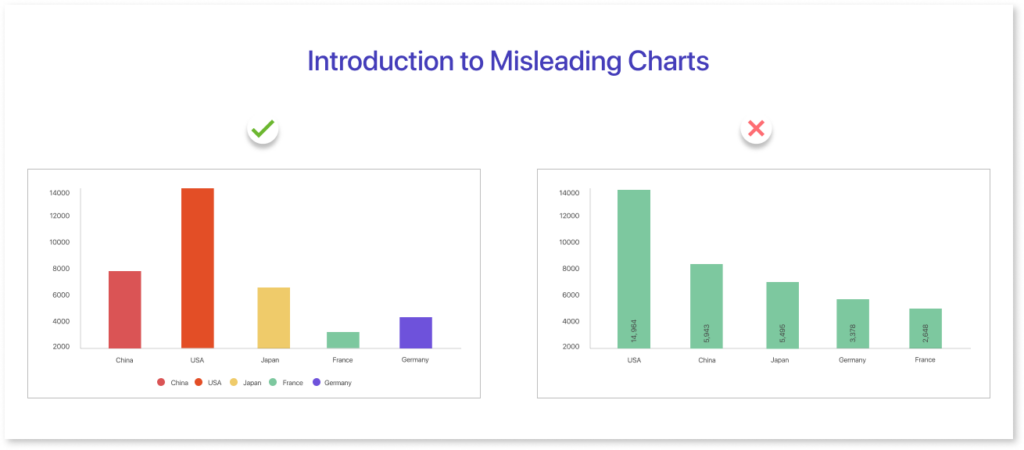
2. Misleading Colors in Data Visualization
Colors influence perception more than people realize.
Using aggressive colors (like red vs green) can:
- create emotional bias
- exaggerate importance
- suggest trends that aren’t significant
This is one of the most subtle data visualization mistakes, yet extremely effective.
3. Using 3D Charts (Classic Data Visualization Mistake)
3D charts look appealing but distort reality.
They:
- skew proportions
- hide smaller segments
- make comparison difficult
👉 This is a classic visualization error.
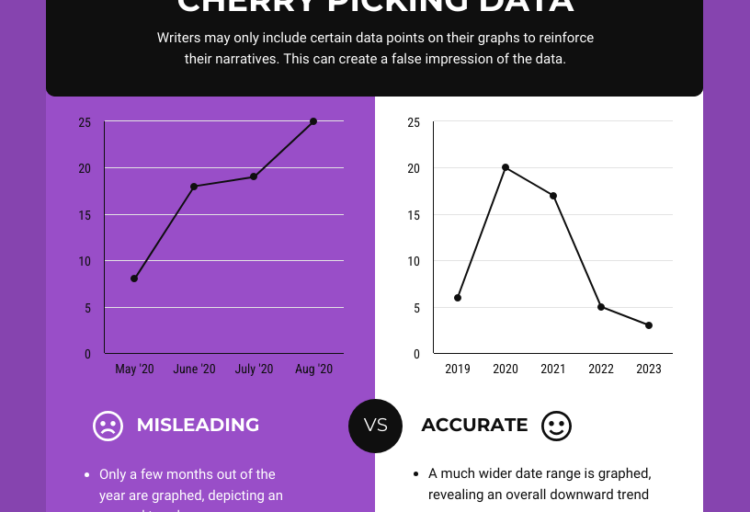
4. Cherry-Picked Time Ranges
By selecting specific start and end dates, a chart can tell completely different stories.
👉 This data visualization mistake is often used to:
- show growth instead of decline
- hide long-term trends
- manipulate perception
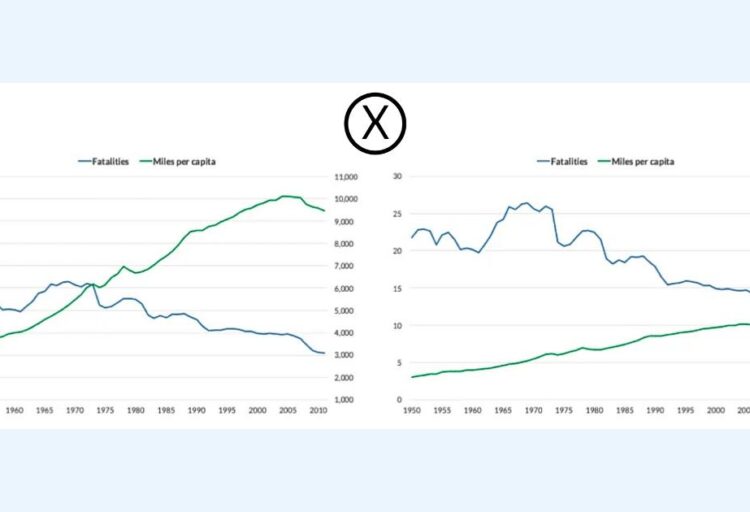
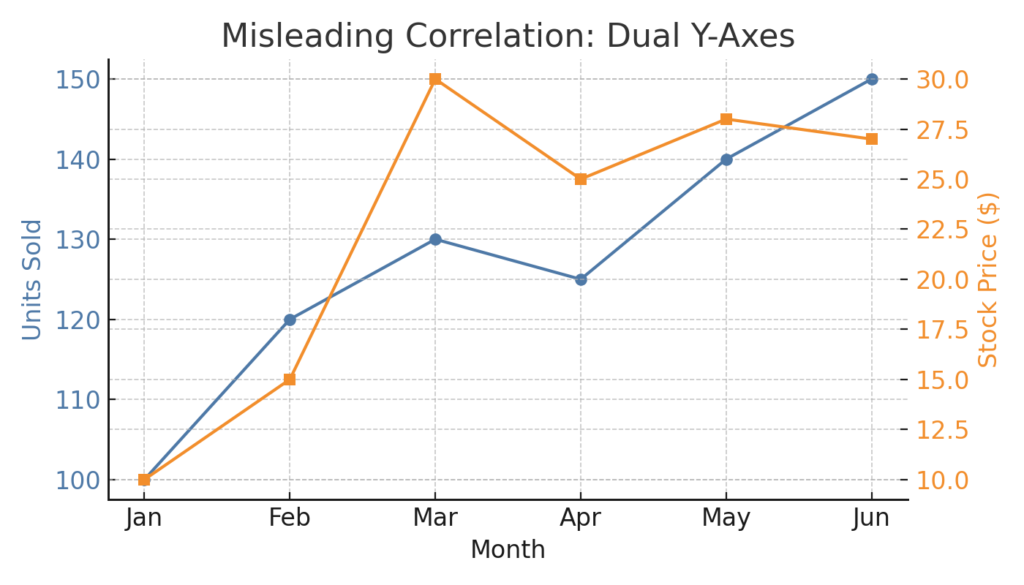
5. Dual Y-Axis Confusion
Dual-axis charts can create fake relationships between variables.
👉 Example:
- sales vs temperature
- GDP vs random metric
This data visualization mistake tricks the brain into seeing correlation where none exists.
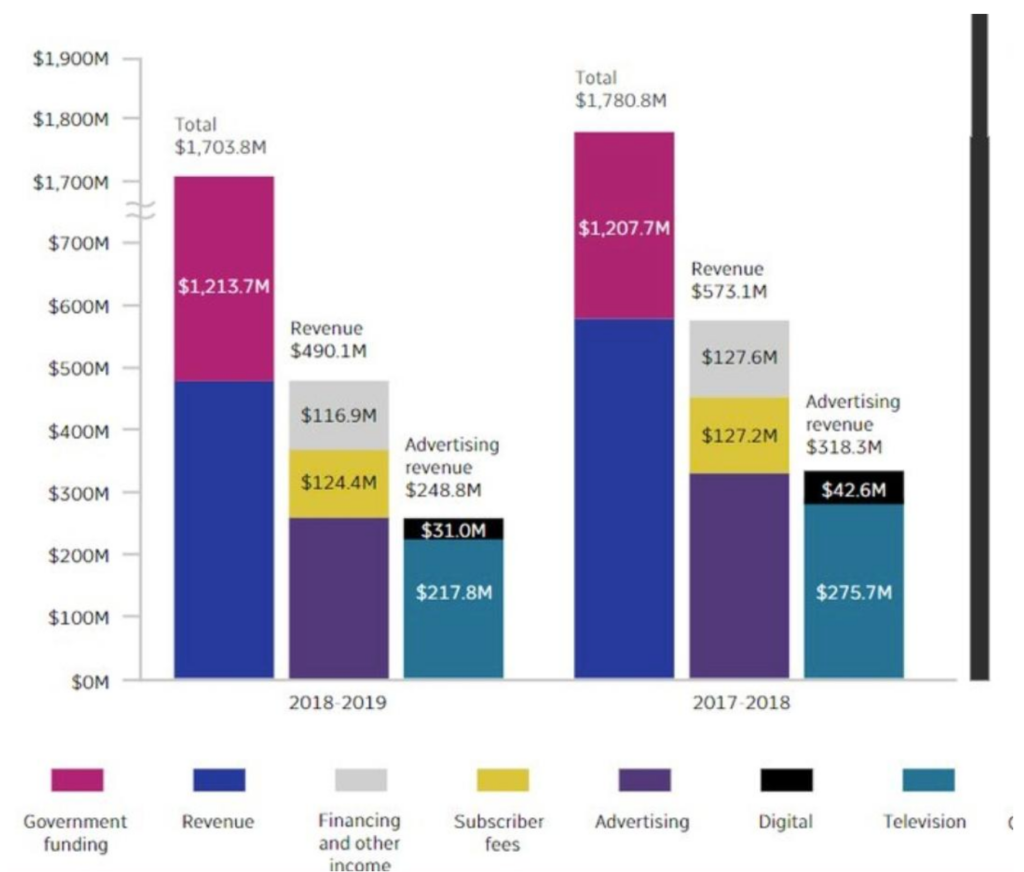
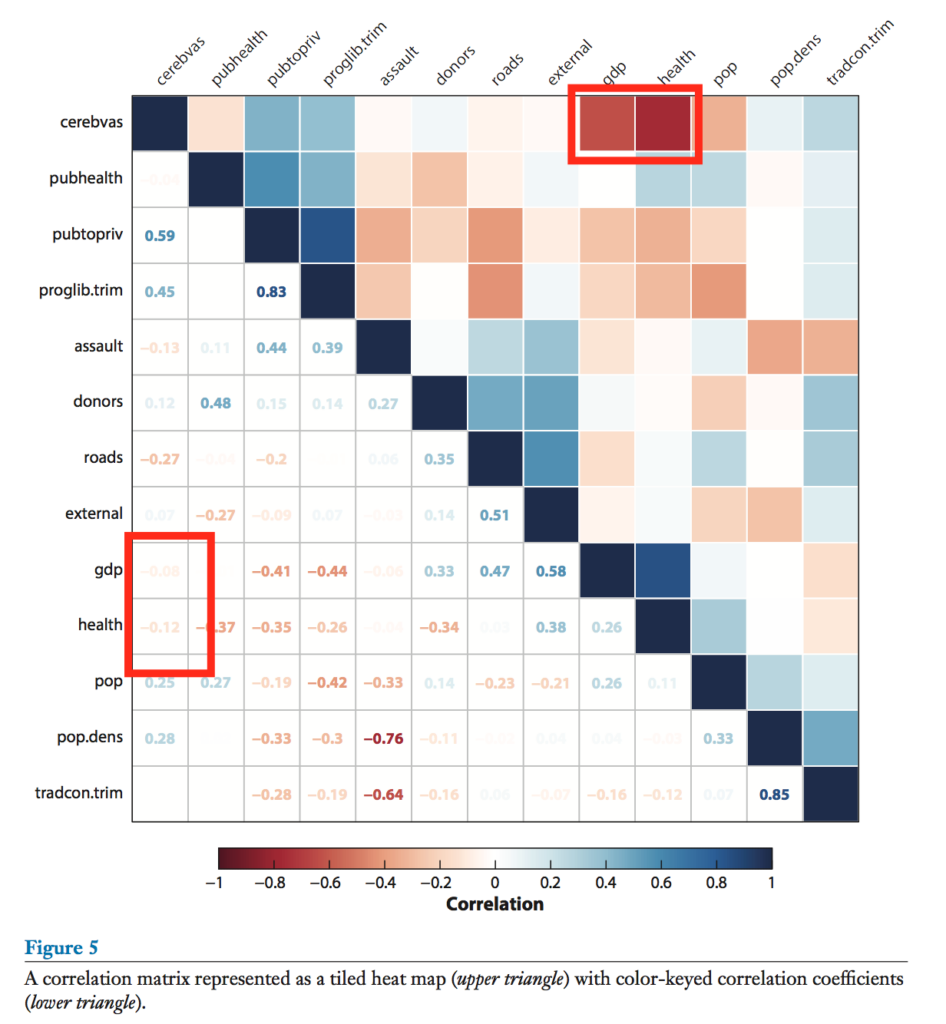
6. Overloaded Charts
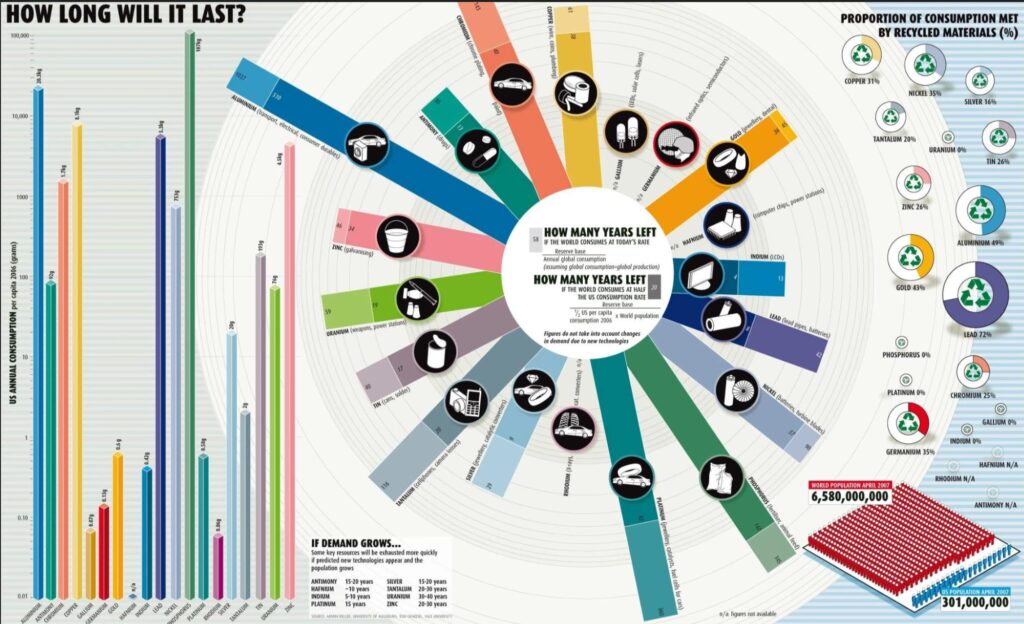
Too much information in one chart leads to confusion.
Common issues:
- too many variables
- unreadable labels
- cluttered design
👉 This reduces clarity and increases misinterpretation.
7. Misleading Pie Charts
Pie charts are often misused.
Problems include:
- too many categories
- small differences impossible to compare
- distorted perception
👉 Another frequent data visualization mistake.
8. Ignoring Context
Data without context is misleading.
Examples:
- percentages without base numbers
- trends without timeframe
- comparisons without scale
👉 This is one of the most misleading issues in data interpretation.
9. Misleading Labels
Labels guide interpretation.
Bad labels can:
- misrepresent data
- omit important details
- bias conclusions
👉 Even accurate data can become misleading due to poor labeling.
10. Bad Scaling Choices
Scaling impacts perception.
Non-linear or inconsistent scales can:
- exaggerate trends
- hide variation
- confuse readers
👉 This is a fundamental data visualization mistake.
How to Avoid Data Visualization Mistakes
To avoid misleading charts, you should always question how data is presented:
- always check axes
- look for missing context
- question visual exaggeration
- compare raw data when possible
Being critical of charts helps you avoid being misled.
Many common data visualization mistakes are explained in detail by FlowingData, which provides real-world examples of misleading charts.
FAQ
What are data visualization mistakes?
Data visualization mistakes are errors in charts or graphs that distort how data is perceived. These mistakes can exaggerate trends, hide important information, or mislead readers.
Why do data visualization mistakes happen?
Data visualization mistakes often happen due to poor design choices, lack of context, or intentional manipulation to influence interpretation.
How can you spot data visualization mistakes?
You can spot data visualization mistakes by checking axes, scales, labels, and whether the data is presented with full context.
Are misleading charts always intentional?
No. Some data visualization mistakes are accidental, while others are intentionally designed to influence perception.
🔗 Explore more misleading data examples
These examples show how misleading graphs, misleading statistics, and misleading news can shape perception and influence decisions.
If you found these data visualization mistakes interesting, you may also want to explore how data can be manipulated in different contexts:
👉 25 Misleading Graphs Examples That Fooled Millions