Introduction
In 2008, a politician could point to one month of falling unemployment and claim the economy was improving. A company could show only its best customer reviews and pretend everyone loves its product. A news article could highlight one dramatic data point while ignoring the long-term trend.
All of these are examples of the same problem: cherry picking statistics.
Cherry picking happens when someone selectively uses data that supports a claim while ignoring data that contradicts it. It is one of the most common ways statistics become misleading, because the numbers may be technically true while the conclusion is still distorted.
In this article, we’ll look at 12 cherry picking statistics examples that show how selective data can mislead people in politics, business, health, media, finance, and everyday life.
Quick Answer: What Is Cherry Picking Statistics?
Cherry picking statistics means selecting only the data points, time periods, studies, or examples that support a specific argument while ignoring evidence that gives a fuller or more accurate picture.
It is misleading because the selected data may be accurate, but the overall conclusion becomes biased.
Cherry Picking Statistics Examples at a Glance
| Example | What Gets Cherry-Picked | Why It Misleads |
|---|---|---|
| Political unemployment claims | A single month or year | Ignores the broader economic trend |
| Company reviews | Only positive testimonials | Hides average or negative experiences |
| Climate data | Short cold periods | Ignores long-term warming trends |
| Stock market returns | Best-performing years | Hides losses and volatility |
| Medical studies | Positive studies only | Ignores weak or negative evidence |
| Education statistics | One successful school | Ignores broader system-level data |
| Crime statistics | One city or one year | Creates a distorted picture of safety |
| Diet claims | Individual success stories | Ignores people who failed or quit |
| Social media metrics | Viral posts only | Hides normal engagement levels |
| Graphs | Convenient start and end points | Exaggerates or hides changes |
What Does Cherry Picking Mean in Statistics?
In statistics, cherry picking means choosing only the data that supports a preferred conclusion.
The term comes from the idea of picking only the best cherries from a tree and ignoring the rest. In data analysis, this means selecting only the most favorable numbers while leaving out important context.
Cherry picking can happen in many ways:
- choosing a convenient time period
- using only one study while ignoring others
- highlighting only positive results
- excluding inconvenient categories
- focusing on outliers
- using selective examples instead of representative evidence
The most dangerous thing about cherry picking statistics is that the data being shown may not be fake. The problem is what has been left out.
Why Cherry Picking Statistics Is Misleading
Cherry picking statistics is misleading because it creates a false impression of certainty.
A person can use real numbers and still create a deceptive argument if they selectively present only part of the evidence.
For example, if a company says, “Our sales increased by 40% last month” that sounds impressive. But if sales had fallen for the previous six months, the statement becomes much less meaningful.
The statistic is true, but incomplete.
This is why cherry picking is closely related to misleading statistics examples, misleading data examples, and selection bias examples. In each case, the problem is not always the number itself. The problem is how the number was selected, framed, or presented.
Recommended Books on Statistics and Critical Thinking
If you want to understand how statistics can be manipulated, these books are useful starting points:
- How to Lie with Statistics – A classic introduction to misleading statistics, cherry-picked data, and statistical tricks used in everyday arguments.
- The Art of Statistics – A more modern guide to thinking clearly with data, uncertainty, and evidence.
- Thinking, Fast and Slow – A useful book for understanding cognitive biases, confirmation bias, and why people believe misleading claims.
These books are especially relevant if you want to get better at spotting cherry-picked statistics, misleading graphs, and weak data arguments.
1. Cherry Picking Political Statistics

Politics is one of the most common places to find cherry picking statistics.
A politician may highlight a short period where unemployment fell, wages increased, or inflation slowed. The claim may be technically true, but it may ignore the broader trend.
For example, a politician might say:
“Unemployment fell this month, so our economic policy is working.”
That sounds convincing until you look at the larger picture. Maybe unemployment is still higher than it was two years ago. Maybe the decrease is seasonal. Maybe people left the labor force and are no longer counted as unemployed.
The selected statistic supports the political message, but it does not tell the full story.
Why It Misleads
Political cherry picking often uses short-term numbers to make long-term claims.
What to Check
Always ask:
- What time period was selected?
- What happened before and after?
- Is this part of a larger trend?
- Are other indicators telling a different story?
2. Cherry Picking in Climate Change Arguments
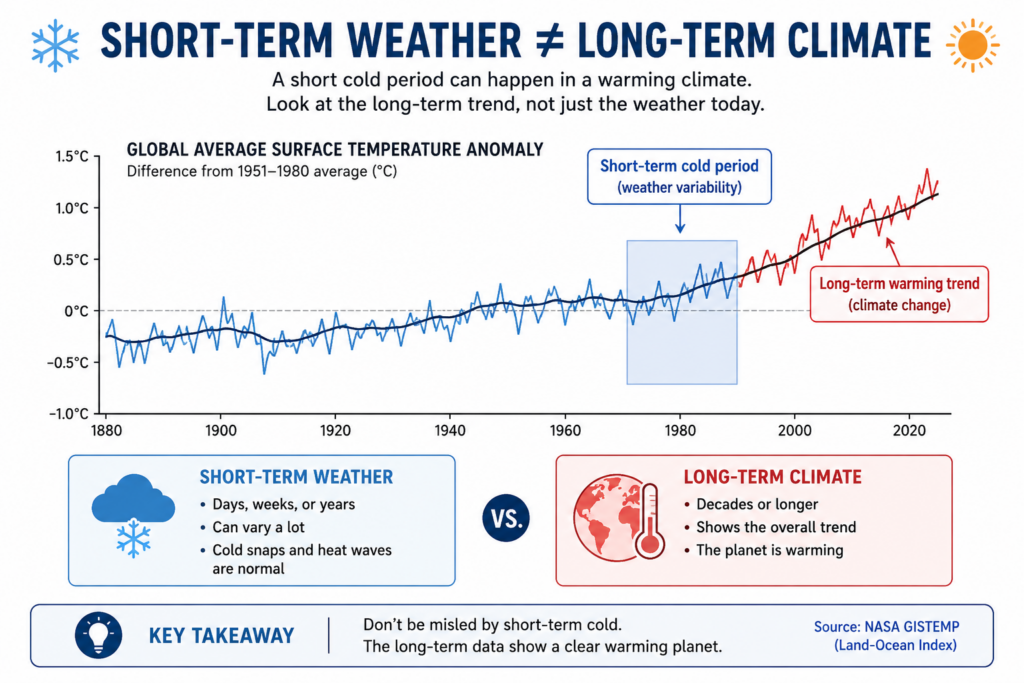
Climate change discussions are full of cherry-picked statistics.
One common example is when someone points to a cold winter, a snowy week, or a short-term temperature drop and uses it to question global warming.
For example:
“It was freezing this winter, so climate change must not be real.”
This argument cherry-picks local or short-term weather data while ignoring long-term global climate trends.
Weather and climate are not the same thing. Weather refers to short-term conditions. Climate refers to long-term patterns over decades.
A single cold winter does not disprove a warming trend, just as one hot day does not prove climate change by itself.
Why It Misleads
Short-term weather events are used to distract from long-term climate data.
What to Check
Look for long-term datasets, global averages, and multi-decade trends instead of isolated events.
For long-term climate trends, sources such as Our World in Data are more useful than isolated weather events.
3. Cherry Picking Stock Market Performance
Investment marketing often relies on cherry-picked statistics.
A fund manager might advertise:
“Our fund returned 18% last year.”
That sounds impressive, but the number may hide years of poor performance.
The fund may have lost money the previous year. It may have underperformed the market over five years. It may have taken much higher risks than a comparable index fund.
Cherry picking is especially common when financial products highlight their best-performing time periods.
For example:
- “Best 12-month return”
- “Top-performing fund in 2023”
- “Up 200% since launch”
These numbers may be real, but they do not necessarily show whether the investment is reliable.
Why It Misleads
Investors may see only the most favorable performance window.
What to Check
Compare performance across multiple time frames:
- 1 year
- 3 years
- 5 years
- 10 years
- performance during downturns
- performance after fees
4. Cherry Picking Medical Studies
Medical claims often become misleading when people cherry-pick studies.
Suppose ten studies test whether a supplement improves sleep. Seven find no meaningful effect, two find a small effect, and one finds a strong positive effect.
A company selling the supplement may promote only the one positive study.
The claim may sound scientific because it is based on research. But the conclusion is misleading because most of the evidence was ignored.
This is common in health marketing, supplement advertising, diet claims, and wellness trends.
Cherry picking medical studies can be especially dangerous because people may make health decisions based on incomplete evidence.
In medical research, sources such as the National Institutes of Health can help readers understand why individual studies should be interpreted carefully.
Why It Misleads
One study is presented as if it represents the entire scientific consensus.
What to Check
Look for:
- systematic reviews
- meta-analyses
- sample size
- conflicts of interest
- whether other studies found similar results
5. Cherry Picking Customer Reviews
Businesses often cherry-pick customer reviews to make products look better than they really are.
A website might display five glowing testimonials:
“This product changed my life.”
“Best purchase I ever made.”
“I recommend this to everyone.”
These reviews may be real. But they may not represent the average customer experience.
The company may hide negative reviews, ignore neutral feedback, or feature only customers who had unusually good outcomes.
This is especially common in:
- online courses
- fitness programs
- supplements
- software tools
- coaching services
- ecommerce products
Customer testimonials can be useful, but they are not the same as representative data.
Why It Misleads
The best reviews are shown while average and negative experiences are hidden.
What to Check
Look at independent review platforms, verified buyer reviews, and the distribution of ratings.
6. Cherry Picking in Advertising
Advertising often uses selective statistics to make products sound more impressive.
Examples include:
“9 out of 10 users recommend this product.”
“Clinically tested.”
“Up to 50% more effective.”
“Customers saw results in just 7 days.”
The key phrase is often “up to.”
If a product claims “up to 50% improvement,” that may mean one person achieved a 50% improvement while most users saw much smaller results.
The statistic is not necessarily false, but it may represent the best possible case rather than the typical case.
This is a classic example of cherry picking statistics in marketing.
Why It Misleads
Advertising often highlights the most favorable result instead of the average result.
What to Check
Look for words like:
- up to
- as much as
- may help
- clinically shown
- based on selected users
- results may vary
These phrases often signal that the strongest result is being emphasized.
7. Cherry Picking Crime Statistics
Crime statistics can be easily cherry-picked because crime varies by location, time period, category, and reporting method.
A news article might say:
“Crime increased by 40% in this city.”
That sounds alarming, but the meaning depends on context.
Maybe the increase was from 5 incidents to 7 incidents. Maybe only one type of crime increased while overall crime decreased. Maybe reporting changed. Maybe the city had an unusually low crime rate the year before.
Cherry-picked crime statistics can make places seem much more dangerous or much safer than they really are.
Why It Misleads
Crime data can be framed dramatically by selecting specific years, locations, or crime categories.
What to Check
Look for:
- absolute numbers
- percentage changes
- long-term trends
- crime categories
- population size
- reporting changes
A percentage increase without context can be highly misleading.
8. Cherry Picking Education Statistics
Education debates often use cherry-picked statistics.
For example, someone might point to one successful charter school, one high-performing district, or one country with excellent test scores and claim that a specific policy is the solution.
But one example does not prove a policy works everywhere.
A school may perform well because of student demographics, funding, parental involvement, admissions rules, location, or many other factors.
Cherry picking education statistics often turns complex systems into oversimplified arguments.
Why It Misleads
One successful case is treated as proof of a universal solution.
What to Check
Look for broad evidence across many schools, regions, and student groups instead of relying on one standout example.
9. Cherry Picking Social Media Metrics
Social media creates a distorted view of success because people often share only their best-performing numbers.
A creator might say:
“My post got 500,000 views.”
But they may not mention that their previous 50 posts averaged only 2,000 views.
A business might highlight one viral campaign while ignoring dozens of campaigns that failed.
A marketer might show one screenshot of high engagement while hiding the full analytics dashboard.
This creates unrealistic expectations about growth, content performance, and online success.
Why It Misleads
Viral outliers are presented as normal results.
What to Check
Ask for averages, medians, and longer-term performance instead of one impressive screenshot.
10. Cherry Picking Diet and Fitness Results
Diet and fitness marketing often relies on cherry-picked success stories.
You may see before-and-after photos from people who lost 30 pounds, gained muscle, or transformed their bodies in a short period.
Those results may be real, but they may not represent the typical user.
The marketing often excludes:
- people who quit
- people who saw no results
- people who regained the weight
- people who followed additional routines
- people with unusual genetics or circumstances
This creates a misleading impression of how easy or likely the result is.
Why It Misleads
Exceptional outcomes are shown while ordinary outcomes are ignored.
What to Check
Look for average results, dropout rates, and whether the program reports outcomes for all participants.
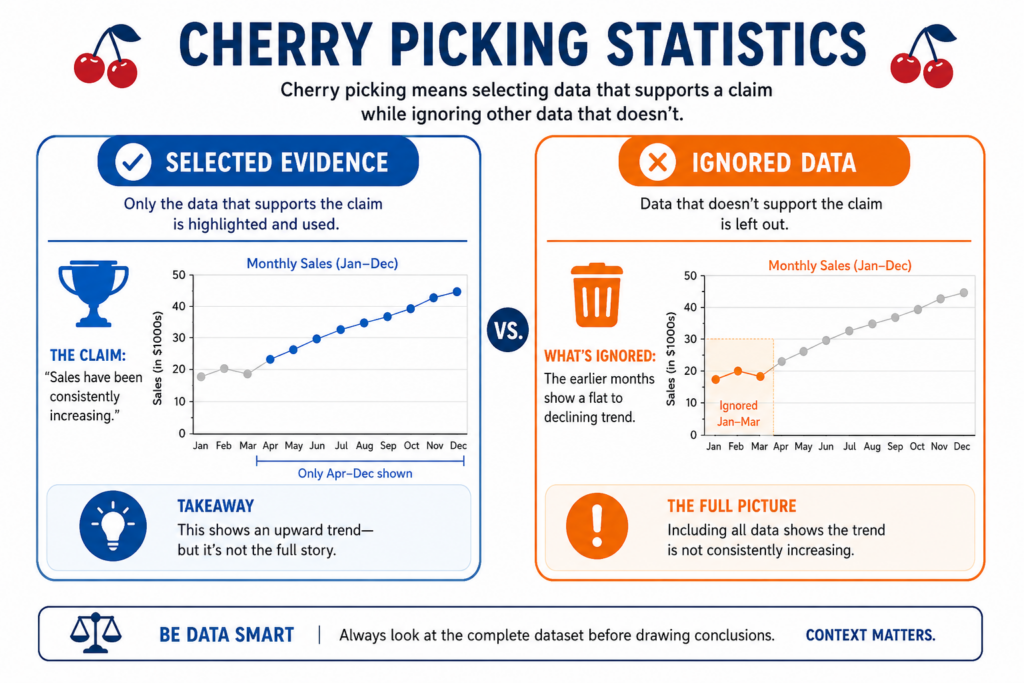
11. Cherry Picking Graphs
Cherry picking statistics becomes even more powerful when combined with misleading graphs.
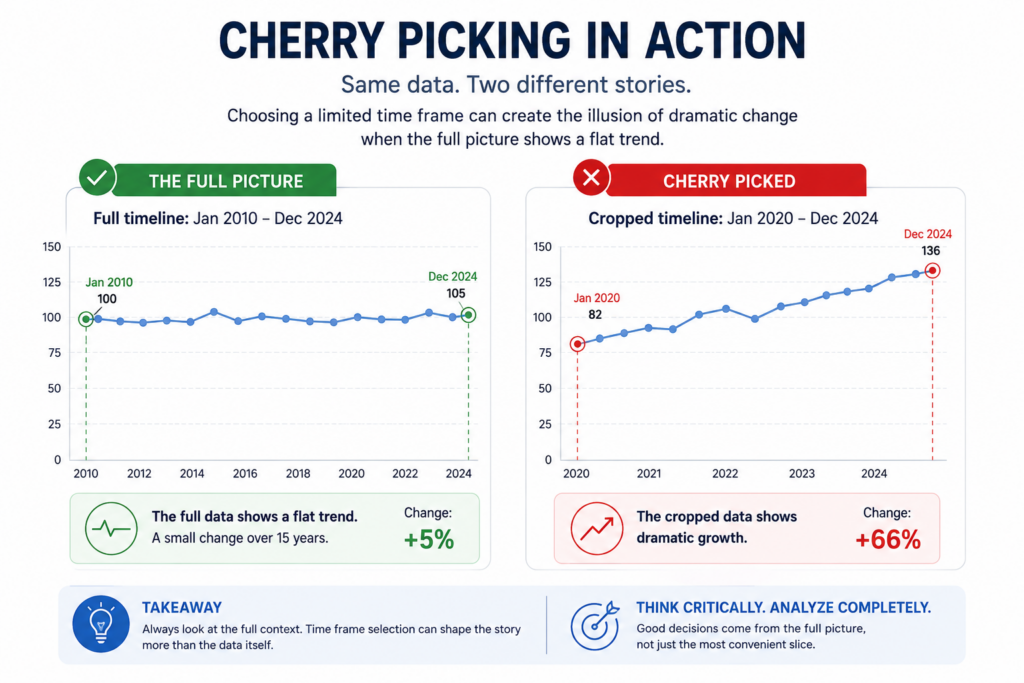
A graph can exaggerate a trend by choosing a convenient start date or end date.
For example, a chart might show a company’s revenue starting from its worst month and ending at its best month. The graph will show dramatic growth even if long-term performance is flat.
Another chart might cut off earlier data that would make the trend look less impressive.
This is one reason misleading graphs examples are so persuasive. Visuals make cherry-picked data feel more objective than it really is.
The same problem can also appear in misleading pie charts when categories are selectively grouped, removed, or emphasized.
Why It Misleads
The graph may be accurate, but the selected time frame distorts the interpretation.
What to Check
Ask:
- Why does the graph start here?
- Why does it end here?
- What happens if the timeline is extended?
- Are important years missing?
- Is the y-axis manipulated?
12. Cherry Picking Scientific Evidence
Scientific evidence can also be cherry-picked in public debates.
People may search for one study that supports their opinion while ignoring the larger body of research.
This happens in debates about:
- nutrition
- psychology
- education
- economics
- climate
- public health
- technology
The problem is not that individual studies are useless. The problem is that one study rarely settles a complex question.
Scientific evidence should be evaluated as a body of research, not as a collection of convenient quotes.
Why It Misleads
One piece of evidence is treated as stronger than the overall pattern of research.
What to Check
Look for consensus statements, systematic reviews, replication studies, and whether multiple independent researchers reach similar conclusions.
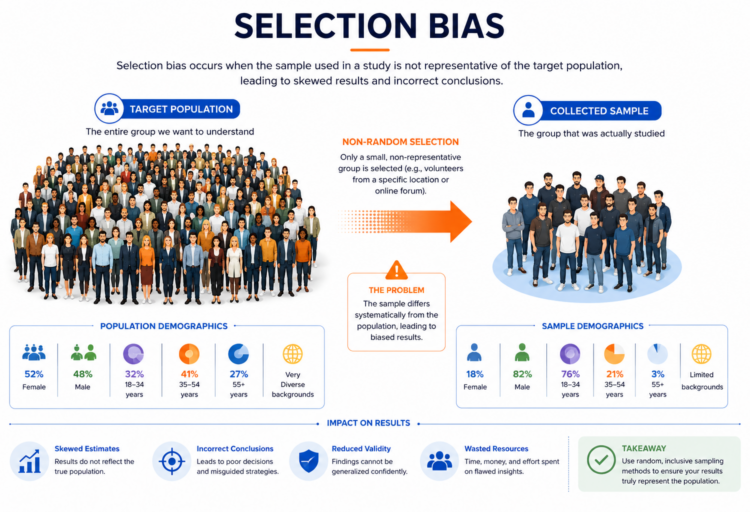
Cherry Picking vs Selection Bias
Cherry picking and selection bias are closely related, but they are not exactly the same.
Selection bias usually refers to a problem in how data is collected or included in a sample. Cherry picking usually refers to selectively presenting data after it already exists.
In simple terms:
- Selection bias affects what data enters the analysis.
- Cherry picking affects what data is shown to the audience.
For example, if a survey includes only wealthy voters, that is selection bias. If a politician has access to full polling data but shares only the most favorable poll, that is cherry picking.
Both can lead to misleading conclusions.
This is why cherry picking statistics often overlaps with selection bias examples and misleading data examples.
Cherry Picking vs Confirmation Bias
Cherry picking is also closely connected to confirmation bias.
Confirmation bias is the tendency to favor information that supports what we already believe.
Cherry picking is one way confirmation bias appears in arguments.
For example, someone who believes a diet works may search only for success stories and ignore negative results. Someone who dislikes a policy may highlight only the worst examples and ignore cases where it worked.
The person may not even realize they are cherry-picking data.
Simple Difference
Confirmation bias is the mental tendency.
Cherry picking is the behavior of selecting only favorable evidence.
How to Spot Cherry Picking Statistics
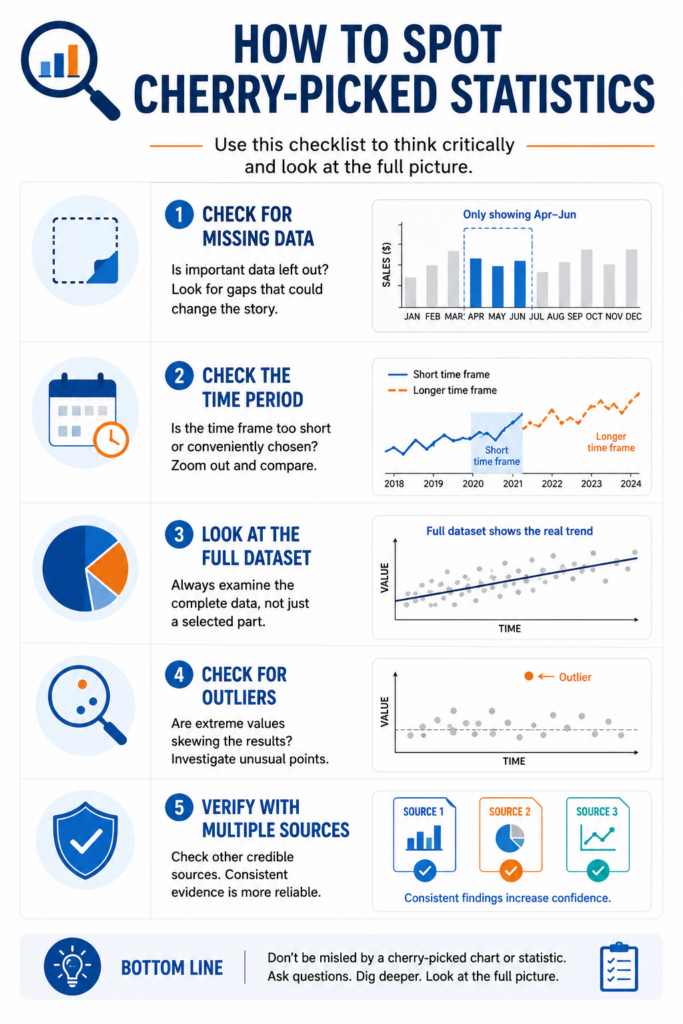
Cherry picking can be hard to notice because the numbers often look legitimate.
Use this checklist when evaluating a statistic.
1. Ask What Was Left Out
The most important question is:
“What data am I not seeing?”
If a claim shows only one number, one example, or one time period, there may be missing context.
2. Check the Time Period
Cherry picking often depends on selecting a convenient start and end date.
A trend may look very different over:
- one month
- one year
- five years
- ten years
- several decades
3. Look for the Full Dataset
A statistic is more trustworthy when the full dataset is available.
Be cautious when someone shows only a screenshot, summary, or isolated number.
4. Compare Multiple Sources
If only one source supports a claim, be careful.
Look for whether other credible sources reach the same conclusion.
5. Watch for Outliers
One extreme example does not prove a general rule.
If a claim depends on an unusually successful person, company, city, or study, it may be cherry-picked.
6. Separate Examples From Evidence
Examples can illustrate a point, but they do not automatically prove it.
A strong argument needs representative evidence, not just memorable stories.
How to Avoid Cherry Picking Data
If you are creating content, analyzing data, or making decisions, avoiding cherry picking is essential.
Use the Full Time Frame
Do not choose dates only because they make your argument look stronger.
Use a time frame that is relevant to the question.
Show Negative and Positive Results
If some evidence supports your claim and some evidence weakens it, acknowledge both.
This makes your analysis more credible.
Use Representative Samples
Avoid relying only on the easiest examples to find.
A representative sample is more valuable than a dramatic example.
Report Averages, Not Just Extremes
Extreme outcomes can be interesting, but they should not replace typical results.
Use averages, medians, ranges, and distributions when possible.
Explain Limitations
Every dataset has limitations.
Being transparent about them makes your conclusion stronger, not weaker.
For broader statistical guidance, organizations such as the American Statistical Association provide useful resources on responsible statistical practice.
Why Cherry Picking Statistics Works So Well
Cherry picking works because it gives people a simple story.
Most people do not have time to inspect full datasets, compare studies, or analyze methodology. A single clear statistic is easier to remember than a complicated explanation.
This makes cherry-picked statistics powerful in:
- headlines
- political speeches
- advertisements
- social media posts
- investment pitches
- health claims
- viral charts
The statistic feels persuasive because it is specific. But specificity is not the same as accuracy.
A number can be precise and still be misleading.
Want to Get Better at Spotting Bad Data?
Cherry picking statistics is only one way data can mislead people. If you want to improve your statistical thinking, these books are worth reading:
- How to Lie with Statistics – Best for beginners who want a simple explanation of how numbers can be used to mislead.
- The Art of Statistics – Best for readers who want a deeper but still accessible explanation of data, probability, and uncertainty.
- Thinking, Fast and Slow – Best for understanding the psychological side of bad reasoning, bias, and decision-making.
A better understanding of statistics makes it easier to recognize misleading claims in politics, advertising, health, finance, and the media.
Frequently Asked Questions
What is cherry picking in statistics?
Cherry picking in statistics means selecting only the data that supports a specific claim while ignoring data that contradicts it. The selected numbers may be accurate, but the conclusion can still be misleading because important context is missing.
What is a simple example of cherry picking statistics?
A simple example is a company showing only its best customer reviews while hiding negative reviews. The positive reviews may be real, but they do not represent the full customer experience.
Why is cherry picking statistics misleading?
Cherry picking is misleading because it presents incomplete evidence as if it were the full picture. This can make weak arguments appear stronger than they really are.
Is cherry picking the same as lying?
Not always. Cherry picking does not necessarily involve inventing false data. The problem is selective presentation. A person can use real statistics and still mislead people by leaving out important information.
What is the difference between cherry picking and selection bias?
Selection bias usually happens when the data sample itself is not representative. Cherry picking happens when someone selectively presents only certain parts of the available data. Both can produce misleading conclusions.
What is the difference between cherry picking and confirmation bias?
Confirmation bias is the tendency to favor information that supports existing beliefs. Cherry picking is the act of selecting only the evidence that supports a claim. Cherry picking is often caused by confirmation bias.
How do you identify cherry-picked data?
You can identify cherry-picked data by asking what was left out, checking the time period, looking for the full dataset, comparing multiple sources, and watching for isolated examples or outliers.
Why do people cherry-pick statistics?
People cherry-pick statistics because it helps them make an argument look stronger. This can happen intentionally in politics, advertising, and media, or unintentionally when people search only for evidence that supports what they already believe.
Can graphs cherry-pick data?
Yes. Graphs can cherry-pick data by using selective time periods, excluding inconvenient values, or starting and ending at points that exaggerate a trend. This is one of the most common ways charts become misleading.
How can you avoid cherry picking in your own analysis?
To avoid cherry picking, use complete datasets when possible, show both positive and negative evidence, explain limitations, compare multiple sources, and avoid relying on isolated examples.
Conclusion
Cherry picking statistics is one of the most common ways data becomes misleading.
The numbers may be real. The studies may exist. The examples may be technically accurate. But if only the most convenient evidence is shown, the conclusion can still be distorted.
The 12 cherry picking statistics examples above show how this happens in politics, business, science, advertising, investing, social media, and everyday arguments.
The best way to protect yourself is to ask one simple question:
What information is missing?
That question can reveal whether a statistic is part of a complete analysis or just a carefully selected piece of evidence designed to persuade you.