Introduction
Can a statistic be accurate and still make an advertisement misleading?
Absolutely.
A percentage can exaggerate a small improvement, a scientific study can be presented as stronger evidence than it really is, and an impressive customer testimonial can make an exceptional result appear typical.
Misleading statistics in advertising are especially powerful because numbers create an impression of objectivity. When consumers see claims such as “clinically proven,” “90% effective,” or “20% better,” they may assume those statements are supported by reliable scientific evidence.
Unfortunately, that is not always the case.
In this article, we examine 12 real misleading statistics in advertising examples, including campaigns involving Kellogg’s, Reebok, Skechers, Volkswagen, and other recognizable companies.
Each example explains what the advertisement claimed, what regulators or courts found, and the statistical mistake consumers should learn to recognize.
Quick answer: Misleading statistics in advertising occur when companies use numbers, percentages, research findings, or comparisons in ways that exaggerate benefits, omit important context, or suggest stronger evidence than the available data supports.
The cases below come primarily from official Federal Trade Commission (FTC) records. Some resulted in settlements, while others involved formal findings or court judgments. Those distinctions matter because a settlement does not necessarily mean that a company admitted wrongdoing.

What Are Misleading Statistics in Advertising?
Misleading advertising statistics are numerical claims that give consumers an inaccurate impression of a product, service, or result.
Sometimes the number itself is incorrect.
In other cases, the number may be based on a real observation but presented without enough context to interpret it properly.
Common techniques include:
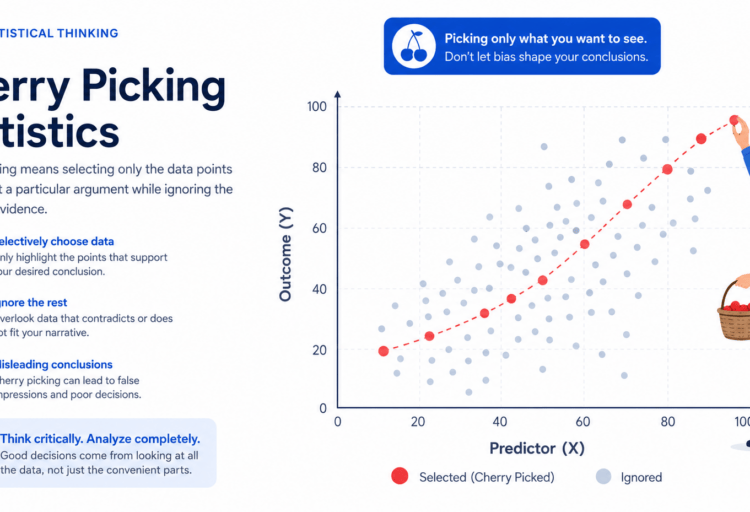
- Cherry-picking: Selecting only favorable results while ignoring contradictory evidence.
- Exaggerated percentages: Highlighting a large relative improvement without explaining the actual difference.
- Misleading averages: Presenting unusual results as though they represent the typical customer experience.
- Unsupported scientific claims: Suggesting that research proves benefits it did not establish.
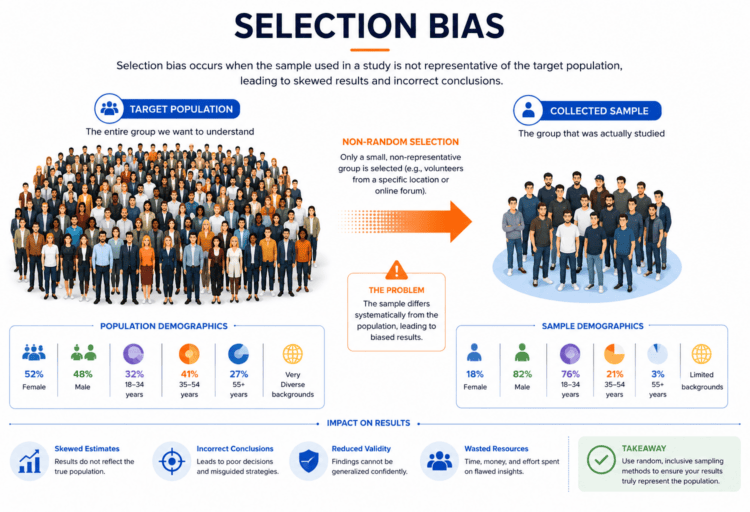
- Unrepresentative samples: Using results from a small or biased group to describe a much larger population.
- Misleading comparisons: Comparing products under conditions that do not reflect normal use.
For example, an advertisement might claim that a product improves performance by 30%.
But what does that actually mean?
Was the improvement measured against a placebo? Did every participant experience it? Was it the average result, the maximum result, or an improvement observed in only a small subgroup?
Without answers to those questions, even an impressive-looking statistic may provide very little useful information.
For more examples of how numerical claims can distort reality, explore our 50 misleading statistics examples.
Misleading Advertising Statistics: 12 Real Examples at a Glance
| Company or Product | Advertising Claim | Main Statistical Problem |
|---|---|---|
| Kellogg’s Frosted Mini-Wheats | Nearly 20% better attentiveness | Exaggerating study findings |
| Reebok EasyTone | Up to 28% more muscle toning | Unsupported percentage claims |
| Skechers Resistance Runner | Up to 85% greater muscle activation | Cherry-picked research results |
| Dannon Activia | Clinically proven digestive benefits | Omitted negative study findings |
| L’Oréal Génifique | Visibly younger skin in seven days | Unsupported scientific claims |
| POM Wonderful | Clinically proven disease-related benefits | Evidence did not support broad health claims |
| Volkswagen Clean Diesel | 90% lower nitrogen oxide emissions | Testing conditions versus real-world results |
| Lumosity | Benefits from 10–15 minutes of brain training | Unsupported claims about real-life outcomes |
| Amberen | Nearly 93% satisfaction and success | Unsupported consumer satisfaction statistics |
| NextMed | Average weight loss of 53 pounds and 23% | Unsubstantiated average-results claims |
| National Urological Group | 19% weight loss and 90% treatment effectiveness | False or unsupported clinical claims |
| Prevagen | Clinically demonstrated memory benefits | Scientific evidence did not support the claims |
These cases illustrate how misleading advertising can involve more than simply inventing numbers.
Sometimes the problem lies in how legitimate measurements are selected, interpreted, or communicated.
12 Real Misleading Statistics in Advertising Examples
1. Kellogg’s Frosted Mini-Wheats: The Misleading 20% Attention Claim
In 2009, Kellogg’s faced scrutiny from the Federal Trade Commission over advertisements for Frosted Mini-Wheats cereal.
The company promoted the idea that eating its cereal for breakfast was clinically shown to improve children’s attentiveness by nearly 20%.
For parents concerned about their children’s academic performance, this sounded like a meaningful and scientifically established benefit.
However, the FTC challenged how the advertising represented the underlying research.
According to the agency, approximately half of the children in the cited study experienced any improvement in attentiveness after eating the cereal.
More importantly, only about one in nine children experienced an improvement of 20% or more.
In another comparison, children eating the cereal performed, on average, just under 11% better on the relevant attention measure than children who skipped breakfast.
The nearly 20% headline therefore did not accurately communicate the typical result.
Why is this misleading?
The advertisement highlighted an impressive percentage without adequately explaining how that figure related to the study participants.
Consumers could reasonably interpret the claim as meaning that children generally experienced an improvement approaching 20%.
The underlying results did not support that broad interpretation.
The lesson: Always ask whether an advertised percentage represents the average participant, the maximum result, or a small subgroup.
Official source: FTC – Kellogg Settles Charges Over Frosted Mini-Wheats Advertising

2. Reebok EasyTone: The 28% Muscle-Toning Promise
Reebok promoted its EasyTone shoes as footwear capable of improving muscle tone simply through walking.
Its advertisements claimed that wearing the shoes could produce:
- Up to 28% more toning of the buttocks.
- Up to 11% more toning of the hamstrings.
- Up to 11% more toning of the calves.
These precise percentages made the product appear to have measurable advantages over ordinary athletic shoes.
However, in 2011, the FTC challenged the scientific support behind those claims.
The agency alleged that Reebok’s testing did not establish the advertised improvements in muscle strength and tone.
Reebok agreed to pay $25 million to settle the FTC’s charges.
Why is this misleading?
The figures created an impression of scientific precision.
But a percentage is meaningful only when the research and measurement methods support it.
The phrase “up to” can be particularly problematic because consumers may interpret an exceptional or maximum result as a realistic expectation.
The lesson: Precise percentages do not automatically mean that a claim is scientifically reliable.
Official source: FTC – Reebok EasyTone Advertising Settlement
3. Skechers: Cherry-Picking the Best Research Results
Skechers marketed its Resistance Runner footwear using impressive muscle-activation statistics.
Advertisements claimed that the shoes could produce:
- Up to 85% greater activation of posture-related muscles.
- Up to 71% greater activation of one buttock muscle.
- Up to 68% greater activation of calf muscles.
These numbers suggested that the shoes delivered substantial physical benefits compared with regular running shoes.
However, the FTC alleged that Skechers selected favorable findings from research rather than accurately representing the overall results.
In 2012, Skechers agreed to pay $40 million to settle charges involving deceptive advertising for its toning footwear.
Why is this misleading?
This example illustrates cherry-picking.
If a study measures several muscles, activities, or outcomes, highlighting only the strongest findings can create a distorted impression.
A large improvement in one measurement does not necessarily establish an equally large overall benefit.
For example, a study might produce positive results for one muscle group but weak or inconsistent findings for several others.
Presenting only the strongest percentage can make the product appear more effective than the full evidence supports.
The lesson: A convincing scientific claim should reflect the complete evidence, not just the most impressive findings.
Learn more about this technique in our guide to 12 cherry-picking statistics examples.
Official source: FTC – Skechers Toning Shoes Advertising Settlement
4. Dannon Activia: When Negative Studies Are Left Out
Dannon advertised its Activia yogurt as a product supported by scientific research demonstrating digestive benefits.
The advertisements emphasized clinical evidence, making the product appear particularly credible.
However, the FTC questioned whether the research supported the broad claims being presented.
According to the agency’s complaint, eight of ten relevant studies failed to show a statistically significant improvement in intestinal transit time when Activia was compared with a placebo.
The FTC also alleged that some scientific summaries omitted studies that did not support the advertised benefits.
Why is this misleading?
Imagine that a company conducts ten studies.
Two produce encouraging results, while eight fail to demonstrate a statistically significant effect.
If the company promotes only the two favorable studies, consumers may believe the scientific evidence is much stronger than it actually is.
This is a common problem in statistical interpretation.
A lack of statistical significance does not necessarily prove that a product has no effect. However, selectively reporting positive findings can still misrepresent the overall strength of the evidence.
The lesson: When advertisements mention clinical studies, look for the complete body of research, including negative and inconclusive results.
Official source: FTC – Dannon Activia and DanActive Advertising Claims
5. L’Oréal Génifique: Younger Skin in Just Seven Days
L’Oréal used scientific terminology to promote its Lancôme Génifique and L’Oréal Paris Youth Code skincare products.
The advertising suggested that the products could influence gene activity and produce visible anti-aging benefits.
Some promotions promised visibly younger-looking skin in just seven days.
These claims were particularly persuasive because they combined scientific language with a specific timeline.
However, in 2014, the FTC challenged the scientific support behind these statements.
The agency alleged that the advertisements made false or unsubstantiated claims about affecting gene activity and producing anti-aging benefits.
L’Oréal agreed to settle the charges.
Why is this misleading?
Scientific terminology can make an advertisement appear more authoritative than the evidence justifies.
Terms such as “clinically proven,” “gene activity,” and “scientific breakthrough” may lead consumers to assume that researchers have conclusively demonstrated a product’s effectiveness.
However, laboratory findings and observations about biological processes do not necessarily prove the specific benefits promised to consumers.
The lesson: Scientific language should never replace clear evidence that a product produces the advertised result.
Official source: FTC – L’Oréal Anti-Aging Advertising Settlement
6. POM Wonderful: When “Clinically Proven” Goes Too Far
POM Wonderful promoted pomegranate juice and supplements using claims about serious health conditions.
Its advertisements suggested that the products could help prevent, treat, or reduce risks associated with conditions including heart disease and prostate cancer.
The marketing frequently referred to scientific research to support these benefits.
However, the FTC concluded that several disease-related claims were deceptive or inadequately supported by scientific evidence.
In 2015, a federal appeals court upheld important parts of the FTC’s decision.
Why is this misleading?
The central problem is the difference between suggestive research findings and scientifically established benefits.
A preliminary study may identify a possible relationship between a food ingredient and a biological marker.
That does not automatically mean that consuming the product prevents or treats a disease.
Advertisers can mislead consumers when they transform limited research findings into much broader health promises.
The lesson: The strength of an advertising claim should never exceed the strength of the scientific evidence behind it.
Official source: FTC – POM Wonderful Appellate Ruling
7. Volkswagen Clean Diesel: When Testing Results Hide Reality
Volkswagen promoted certain diesel vehicles as environmentally friendly alternatives to traditional vehicles.
Its Clean Diesel marketing included claims that the technology could reduce nitrogen oxide emissions by 90%.
For environmentally conscious consumers, this was an important selling point.
However, the company became involved in a major emissions scandal.
In 2016, the FTC alleged that Volkswagen had deceived consumers through its Clean Diesel advertising.
The affected vehicles contained software designed to recognize emissions testing conditions and alter vehicle behavior.
According to the FTC, the vehicles could emit nitrogen oxides far above legal limits during normal driving.
Why is this misleading?
The problem illustrates the difference between laboratory testing and real-world performance.
A vehicle that performs well under controlled testing conditions does not necessarily produce the same results during everyday use.
If an advertisement uses test results that do not represent normal operation, consumers may draw inaccurate conclusions about the product.
This is particularly important when performance claims influence expensive purchasing decisions.
The lesson: Before trusting a performance statistic, check whether the testing conditions reflect how the product is actually used.
Official source: FTC – Volkswagen Clean Diesel Advertising Case

8. Lumosity: The Promise of 10–15 Minutes of Brain Training
Lumosity marketed online brain-training games designed to improve cognitive performance.
Its advertisements suggested that spending approximately 10–15 minutes playing the games several times per week could improve performance in everyday activities.
Some claims also suggested benefits involving age-related cognitive decline and memory-related conditions.
In 2016, Lumosity agreed to pay $2 million to settle FTC charges that its advertising promises lacked adequate scientific support.
Why is this misleading?
A precise training routine can make a product appear scientifically established.
However, demonstrating improvement on a particular game or exercise does not necessarily prove that the improvement transfers to unrelated tasks.
For example, becoming better at a memory game does not automatically establish that a person will perform better at work or reduce their risk of cognitive decline.
Researchers must test those broader outcomes directly.
The lesson: Improvements in a controlled activity should not automatically be interpreted as improvements in everyday performance.
Official source: FTC – Lumosity Brain-Training Advertising Settlement
9. Amberen: The Misleading 93% Satisfaction Rate
The dietary supplement Amberen was promoted using claims about menopause symptoms and weight loss.
Its advertisements included consumer satisfaction and success figures approaching 93%.
A statistic like this can be highly persuasive.
If almost everyone supposedly benefits from a product, consumers may assume that the chances of success are extremely high.
However, the FTC alleged that these satisfaction and success claims were false.
In 2016, the marketers agreed to settle charges involving misleading advertising claims.
Why is this misleading?
Customer satisfaction percentages can be misleading when the underlying survey or evidence is not reliable.
Several questions matter:
- How many customers participated?
- How were participants selected?
- What counted as a successful outcome?
- Were dissatisfied customers included?
- Was the percentage independently verified?
Without that information, a large satisfaction percentage may create confidence that the evidence does not support.
The lesson: Always question the sample size, selection method, and definition of success behind advertised satisfaction rates.
Official source: FTC – Amberen Advertising Settlement
10. NextMed: An Average Weight Loss of 53 Pounds
NextMed marketed telehealth weight-loss programs using numerical claims about customer results.
Its advertising suggested that members could lose an average of 53 pounds, representing approximately 23% of their body weight.
These figures could make the program appear to produce substantial and predictable results.
However, in July 2025, the FTC alleged that the company lacked adequate evidence to support its advertised average weight-loss claims.
The agency also challenged other marketing practices, including misleading testimonials and pricing information.
A final consent order was approved in December 2025.
Why is this misleading?
An average can sound like a realistic expectation for a typical customer.
But averages depend heavily on how the underlying data is collected and which participants are included.
For example, an average based only on customers who completed a program may not represent everyone who signed up.
Similarly, excluding participants with disappointing results can exaggerate the apparent effectiveness of a service.
These are general statistical risks; they should not be confused with a specific finding that NextMed used each of those methods.
The lesson: Before trusting an advertised average, ask who was included in the calculation and whether the result represents typical customers.
Official source: FTC – NextMed Weight-Loss Advertising Case
11. National Urological Group: The 19% and 90% Claims
National Urological Group and related marketers promoted dietary supplements using dramatic claims about weight loss and sexual health.
According to FTC records, advertisements claimed that certain supplements were clinically proven to produce weight loss of 19% of total body weight.
Other advertisements promoted a treatment as clinically proven to work safely and effectively for 90% of men with erectile dysfunction.
These claims presented substantial benefits as established scientific facts.
However, a federal district court found the marketers liable for deceptive advertising.
In January 2009, the FTC announced that the court had ordered monetary relief exceeding $15 million.
Why is this misleading?
Large percentages can make an unproven treatment appear medically reliable.
A claim that a product works for 90% of patients implies strong evidence about effectiveness across a population.
Similarly, an advertised 19% loss of total body weight suggests a substantial and repeatable outcome.
Such claims require credible supporting research.
Without that evidence, the percentages can create unrealistic expectations.
The lesson: Dramatic medical or performance percentages should be supported by research that directly measures the advertised outcome.
Official source: FTC – National Urological Group Court Ruling
12. Prevagen: When a Study Does Not Prove Memory Benefits
Prevagen was marketed as a dietary supplement that could improve memory and support cognitive performance.
Its advertisements included claims that the product could reduce memory problems associated with aging.
Some statements suggested that scientific studies had clinically demonstrated these benefits.
However, the FTC and New York authorities challenged the evidence supporting those claims.
In 2024, following a jury verdict, a federal court ordered the marketers to stop making the challenged claims.
The jury found that the relevant statements lacked competent and reliable scientific support. It also found two claims concerning age-related memory problems materially misleading.
Why is this misleading?
The phrase “clinically shown” can make consumers assume that a study has conclusively established a product’s benefits.
However, simply conducting a study does not mean the study supports every claim made in an advertisement.
The research must measure the relevant outcome, use appropriate methods, and produce results that justify the specific statement.
This distinction is especially important when advertising targets consumers concerned about their health or cognitive abilities.
The lesson: Always distinguish between a product that has been studied and a product whose advertised benefits have actually been demonstrated.
Official source: FTC – Prevagen Court Ruling
What Do These Misleading Advertising Examples Have in Common?
Although these cases involve different industries, they reveal several recurring problems in how companies communicate numerical information.
1. Percentages Without Enough Context
A large percentage is often easier to remember than the details of a scientific study.
However, a figure such as 20%, 85%, or 93% means little without knowing what was measured and how the percentage was calculated.
2. Selective Use of Research
Positive results can make compelling advertisements.
But focusing only on favorable findings while excluding contradictory evidence can distort the overall picture.
This is closely related to cherry-picking statistics.
3. Confusing Correlation With Causation
Sometimes advertisements imply that a product caused an improvement simply because the improvement occurred among people who used it.
Without an appropriate comparison group, that conclusion may not be justified.
Our guide to correlation vs causation examples explains why observing two related events does not automatically establish a causal relationship.
4. Presenting Exceptional Results as Typical
An unusual success story may be genuine without representing the experience of most customers.
Advertisers should not present exceptional outcomes in ways that suggest everyone can reasonably expect the same result.
5. Using Scientific Language as a Marketing Tool
Words such as “clinically proven,” “scientifically tested,” and “research-backed” can create an impression of credibility.
However, the relevant question is whether reliable research actually supports the exact advertised claim.
How to Spot Misleading Statistics in Advertising
Consumers do not need advanced statistical knowledge to question suspicious advertising claims.
A few simple checks can make a significant difference.
Check the Original Source
Whenever possible, find the scientific study or official report behind an advertised statistic.
A marketing summary may leave out important limitations.
Look at the Sample Size
A percentage based on a small sample may be unreliable or poorly representative of the intended population.
For example, 90% satisfaction among ten participants is very different evidence from 90% satisfaction among several thousand randomly selected customers.
Identify What Was Actually Measured
An improvement in a laboratory measurement does not necessarily establish a meaningful improvement in everyday life.
Check whether the research measured the outcome promised by the advertisement.
Be Careful With Relative Percentages
Relative improvements can sound dramatic even when the absolute difference is small.
For a deeper explanation, read our guide to relative risk vs absolute risk.
Look for Missing or Negative Results
Ask whether the advertiser is presenting the full research findings or only selected positive outcomes.
Question Comparisons
A product might outperform another product under very specific conditions.
Check whether those conditions reflect normal use.
Watch for Misleading Visualizations
Charts and graphs can also exaggerate numerical differences.
Manipulated scales, truncated axes, and inappropriate visual comparisons can create misleading impressions even when the numbers are technically accurate.
See our 25 misleading graphs examples for illustrations of these techniques.
The most important rule is simple: never trust an impressive number without understanding what it actually represents.
Free PDF: Learn to Spot Misleading Statistics
Want to become better at recognizing misleading graphs, percentages, and statistical claims?
Download our free PDF guide to explore common statistical tricks and learn how to interpret numerical information more critically.
FAQ: Misleading Statistics in Advertising
What Is an Example of Misleading Statistics in Advertising?
One example is Kellogg’s Frosted Mini-Wheats advertising campaign, which claimed that eating the cereal could improve children’s attentiveness by nearly 20%.
The FTC challenged the claim because the underlying research did not support that broad interpretation.
Can Advertising Statistics Be Technically True but Still Misleading?
Yes.
A statistic may describe a real observation while creating an inaccurate impression.
For example, a company might highlight the best-performing subgroup from a study without explaining that most participants experienced much smaller improvements.
Why Do Advertisers Use Percentages?
Percentages are easy to understand, remember, and compare.
They can also make differences appear more dramatic.
However, without information about the baseline, sample size, or measurement method, a percentage may be difficult to interpret correctly.
What Are the Most Common Misleading Advertising Techniques?
Common techniques include cherry-picking research findings, using misleading averages, exaggerating relative improvements, omitting comparison groups, and presenting unsupported scientific claims.
Misleading graphs and selective testimonials can also influence how consumers understand numerical information.
How Can Consumers Verify Advertising Claims?
Consumers can look for independent research, inspect the original studies, compare results across multiple sources, and consult regulatory agencies such as the FTC.
Claims involving health or scientific benefits deserve particular scrutiny because their reliability depends heavily on research quality.
Are All Misleading Advertising Claims Illegal?
Not necessarily.
Advertising regulations depend on the jurisdiction, the specific claim, the evidence available, and how a reasonable consumer would interpret the advertisement.
In the United States, the FTC can take action against unfair or deceptive advertising practices.
A settlement does not automatically establish an admission of wrongdoing, so it is important to distinguish regulatory allegations from formal findings.
Recommended Books on Misleading Statistics and Critical Thinking
Understanding misleading advertising becomes easier when you learn how statistics, evidence, and visual communication can influence decisions.
These three books provide useful starting points.
How to Lie with Statistics – Darrell Huff
A classic introduction to the ways numbers, averages, samples, and charts can be presented misleadingly.
The book explains common statistical tricks in an accessible way, making it particularly useful for readers who want to question advertising and media claims.
Calling Bullshit – Carl T. Bergstrom and Jevin D. West
This book explores how misleading quantitative claims spread through science, business, media, and everyday communication.
It provides practical ways to evaluate questionable statistics and identify unsupported conclusions.
The Art of Statistics – David Spiegelhalter
An accessible guide to understanding evidence, uncertainty, probability, and statistical reasoning.
It helps readers develop a more thoughtful approach to interpreting data and evaluating numerical claims.
As an Amazon Associate, EmpireStats earns from qualifying purchases.
Conclusion
Misleading statistics in advertising do not always involve completely fabricated numbers.
Often, the problem is how information is selected, interpreted, or communicated.
A percentage may exaggerate an exceptional result, a clinical study may not support the advertised conclusion, or a comparison may rely on conditions that do not reflect real-world performance.
The twelve examples examined here demonstrate why consumers should look beyond impressive numbers and investigate the evidence behind them.
By checking sample sizes, comparison groups, research methods, and the original sources, readers can become more confident in recognizing misleading advertising claims.
Remember: a statistic becomes meaningful only when its context is clear.