Introduction
Misleading statistics 2025 are more common than ever. From news articles to social media, numbers are often presented in ways that distort reality and influence public perception.
Understanding misleading statistics 2025 is essential if you want to interpret data correctly and avoid being misled. In this article, you’ll discover real examples, common manipulation techniques, and simple ways to detect misleading statistics.
Types of Misleading Statistics
Before exploring misleading statistics 2025, it’s important to understand how data gets manipulated.
1. Misleading Percentages
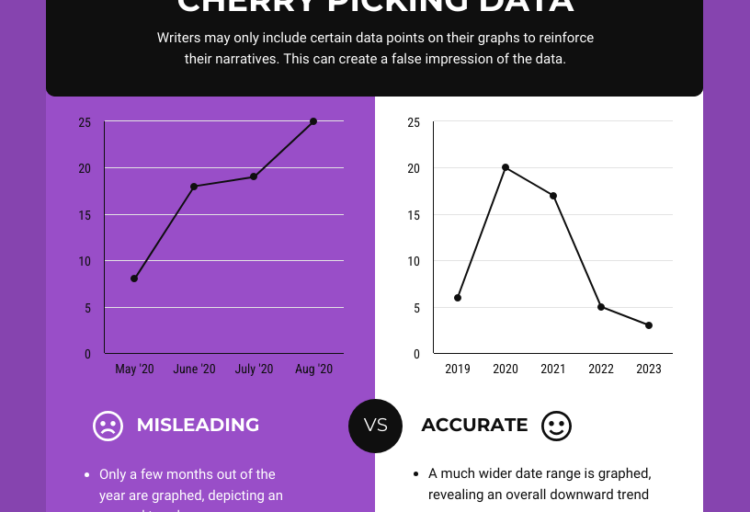
2. Cherry-Picked Data
3. Misleading Averages
4. Lack of Context
5. Small Sample Sizes
A detailed explanation of misleading data techniques is available on Data to Viz.
12 Misleading Statistics 2025 Examples
1. “50% Risk Increase” Headlines
Relative risk used instead of absolute numbers.
2. Income Average Distortion
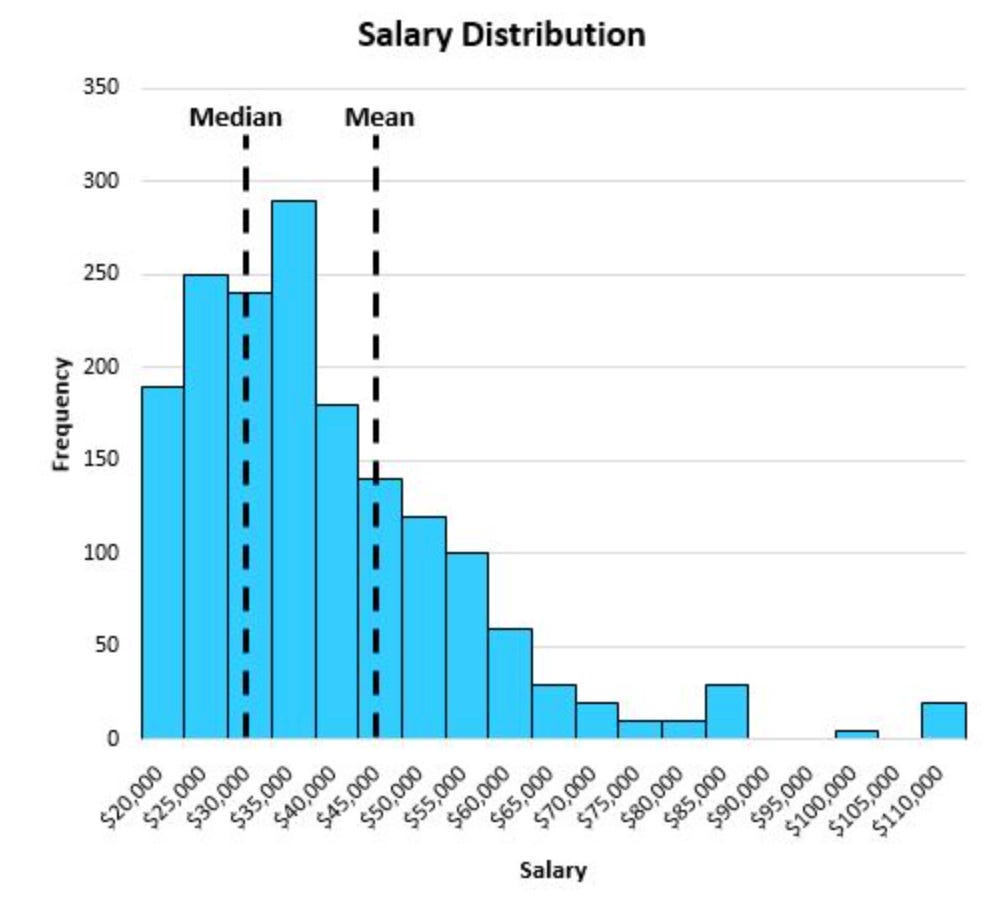
Mean used instead of median income.
3. Small Sample Surveys
Tiny sample presented as general population.
4. Outdated Data Presented as Current
Old data reused in recent articles.
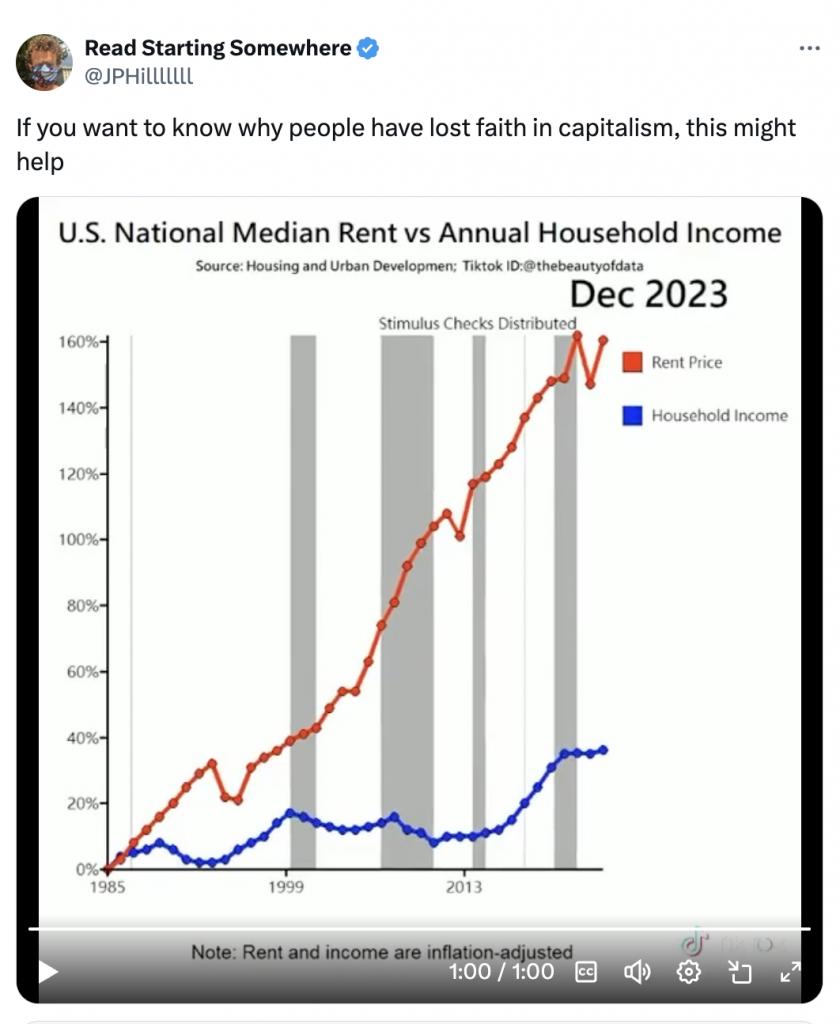
5. Selective Timeframe Trends
Only specific years shown.
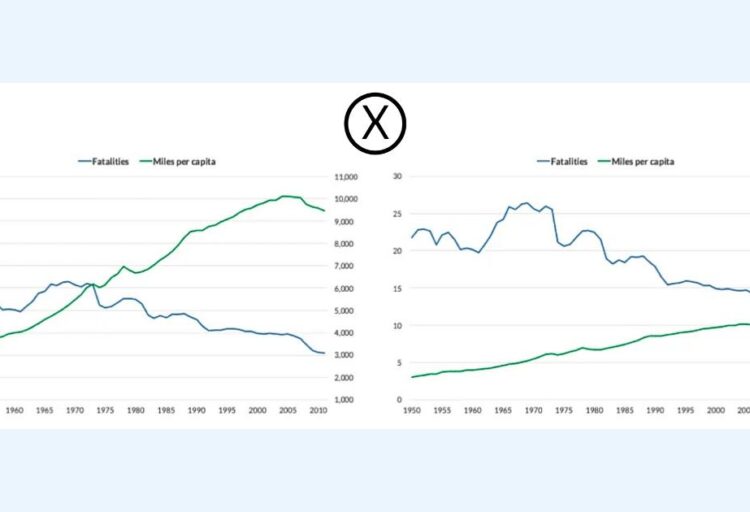
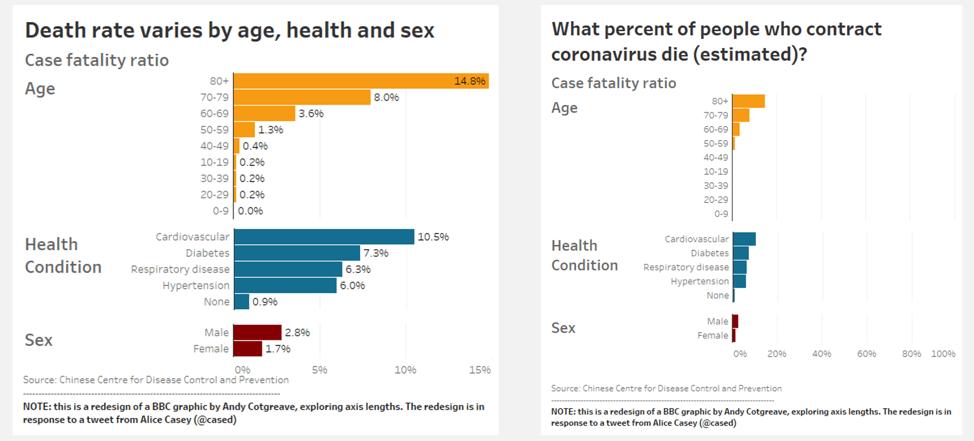
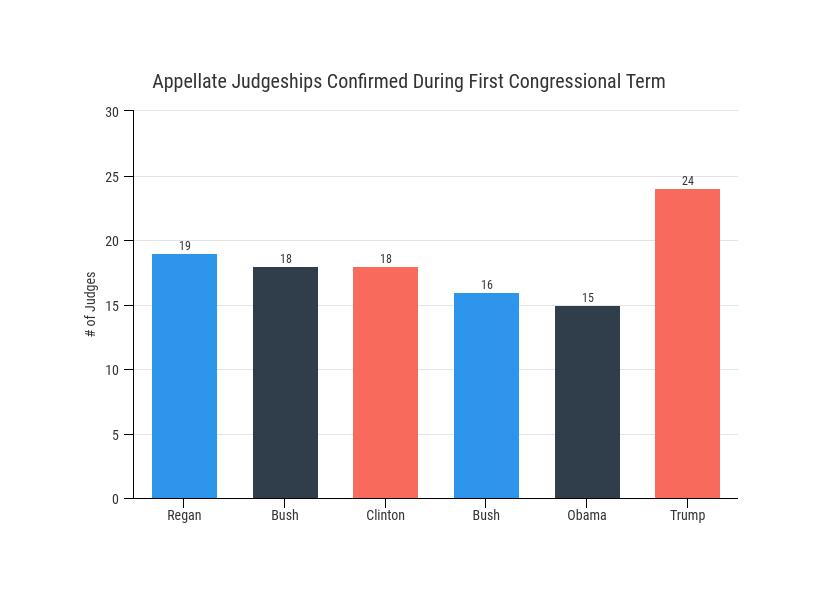
6. Misleading Graph Scales
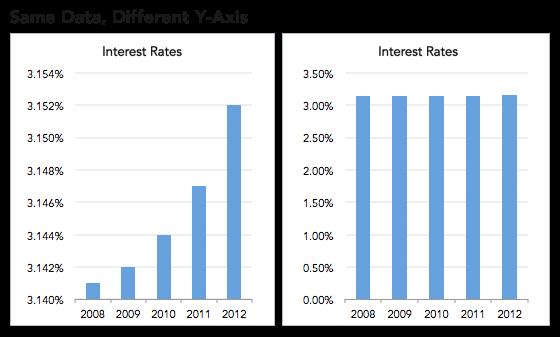
Charts exaggerate trends using scale manipulation.
7. Percentage Without Context
Percentages shown without base values.
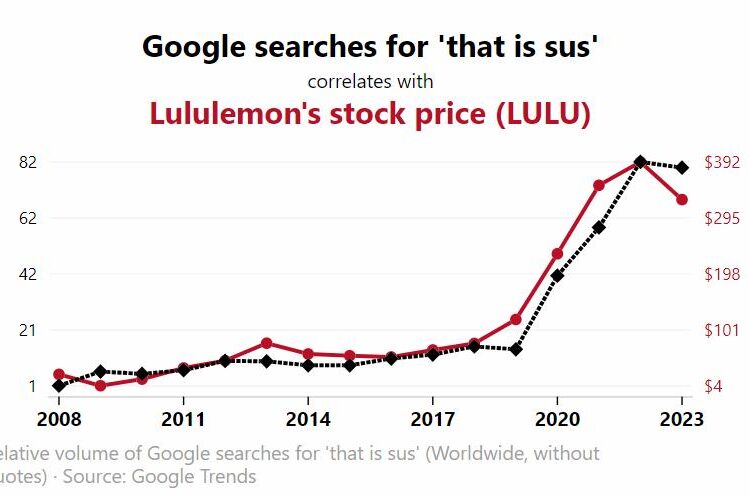
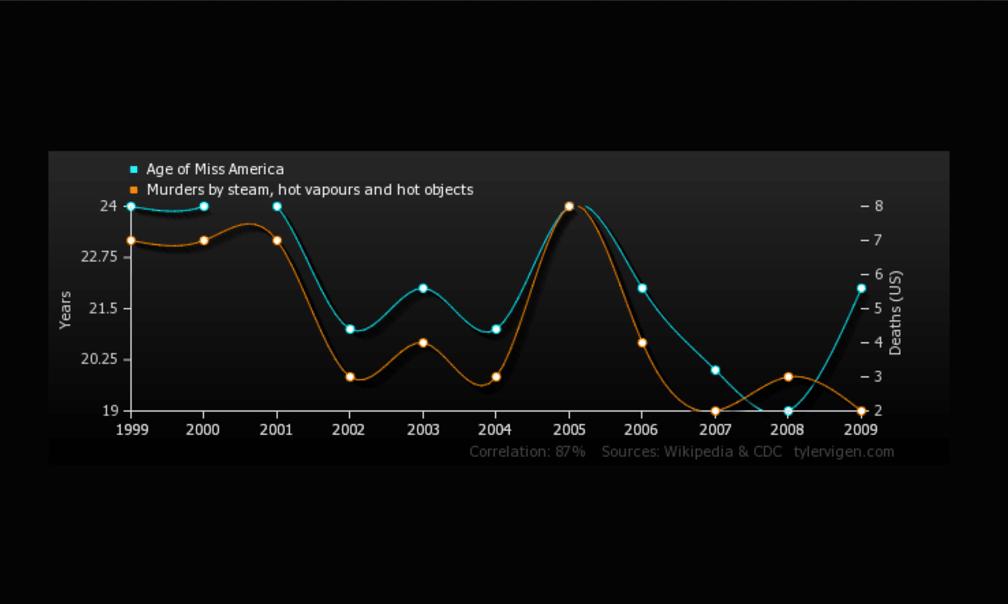
8. Correlation vs Causation
Two variables appear related but are not.
9. Survey Bias
Questions designed to influence answers.
10. Misleading Comparisons
Comparing incompatible datasets.
11. Ignoring Population Size
Raw numbers used instead of per capita.
12. Cherry-Picked Studies
Only favorable studies highlighted.
The Most Common Misleading Statistics in 2025
Misleading statistics 2025 often follow recurring patterns that appear across news, social media, and research articles. These patterns are not random. They are used because they are effective at influencing perception.
For example, many misleading statistics rely on relative percentages instead of absolute numbers. A “100% increase” may sound dramatic, but in reality, it could simply mean going from 1 to 2 cases.
Another common issue is the misuse of averages. Many reports highlight the mean value instead of the median, which can completely distort the real situation, especially in income or economic data.
Understanding these patterns is key to recognizing misleading statistics before they influence your judgment.
Why Misleading Statistics Work
Misleading statistics 2025 are effective because:
- people trust numbers
- data seems objective
- context is often ignored
- headlines simplify complex data
Research from Pew Research Center shows how presentation strongly influences perception.
How to Spot Misleading Statistics
To identify misleading statistics 2025:
1. Check the source
2. Look at the full dataset
3. Question percentages
4. Analyze the graph
5. Look for missing context
Educational platforms like Khan Academy explain these concepts in detail.
Misleading Statistics vs Misleading Graphs
Many misleading statistics 2025 rely on misleading graphs.
👉 https://empirestats.net/2026/03/26/misleading-graphs-examples/
Recommended Resources
To better understand misleading statistics:
- statistics books
- data analysis guides
- visualization courses
You can explore resources on Amazon or take courses on Udemy.
FAQ
What are misleading statistics?
Misleading statistics are numbers presented in a way that distorts reality or misleads interpretation.
Why are statistics misleading?
They can be manipulated through context, scale, or selective data.
How can you identify misleading statistics?
By analyzing data sources, context, and methodology.
Internal links
If you found these misleading statistics 2025 examples useful, explore:
👉 https://empirestats.net/2026/03/26/misleading-graphs-examples/
👉 https://empirestats.net/2026/03/16/misleading-statistics-examples/
👉 https://empirestats.net/shrinkflation-examples/
Why Misleading Statistics Are Increasing in 2025
Misleading statistics 2025 are becoming more frequent due to the rapid growth of online content and data-driven storytelling.
Media outlets compete for attention, and numbers make headlines more convincing. At the same time, readers rarely verify data sources or question how statistics are presented.
This combination makes it easier for misleading statistics to spread quickly and influence large audiences.
As a result, learning how to analyze data critically is becoming an essential skill in 2025.
Conclusion
Misleading statistics 2025 show how easily data can be manipulated. By learning how to analyze numbers critically, you can avoid being misled and make better decisions.