Introduction
A headline says a treatment cuts risk by 50%. That sounds huge. But if the risk falls from 2 in 10,000 to 1 in 10,000, the absolute change is only 1 person out of 10,000.
That is the difference between relative risk and absolute risk.
Relative risk compares one risk to another. Absolute risk shows the real size of the risk. When a headline, ad, study, or political claim only gives the relative number, it can make a small change sound dramatic.
This is why relative risk vs absolute risk examples are so useful. They show how misleading percentages, missing baselines, and incomplete comparisons can distort how people understand data.
The numbers may be technically correct. The problem is the framing.
These relative risk vs absolute risk examples will help you see when a percentage is informative and when it hides the real-world size of the change.
Free PDF: Learn to Spot Misleading Statistics
Learn how to spot cherry picking, biased samples, misleading graphs, fake precision, and other common data tricks.
Download the free guide below.
Quick Answer: What Is the Difference Between Relative Risk and Absolute Risk?

Relative risk compares two risks and shows how much one risk changes compared with another. Absolute risk shows the actual chance that something happens.
For example, if a risk drops from 2% to 1%, the relative risk reduction is 50%, but the absolute risk reduction is only 1 percentage point. Relative risk can sound more dramatic because it hides the baseline.
| Example | Relative Risk Claim | Absolute Risk Reality | Why It Misleads |
|---|---|---|---|
| Medicine | “Cuts risk by 50%” | 2 in 10,000 to 1 in 10,000 | The baseline risk is tiny |
| Disease headline | “Risk doubles” | 1% to 2% | Doubling sounds larger than the real change |
| Supplement | “Reduces illness by 40%” | 5% to 3% | The absolute change is 2 points |
| Safety feature | “Reduces crashes by 60%” | 5 crashes to 2 crashes | Small numbers can exaggerate impact |
| Marketing | “300% more effective” | 1 result to 4 results | The starting point is hidden |
| Business growth | “Revenue grew 200%” | $500 to $1,500 | Big percentage, small business base |
| Politics | “Crime increased 100%” | 2 cases to 4 cases | Rare events sound like a crisis |
| School results | “Failure rate doubled” | 1 student to 2 students | Small sample size matters |
| Side effects | “Risk is 3 times higher” | 1 in 100,000 to 3 in 100,000 | Rare risk may still be rare |
| Website conversion | “Conversions up 150%” | 2% to 5% | Needs baseline and traffic volume |
These relative risk vs absolute risk examples all follow the same pattern: the relative number sounds dramatic, but the absolute number shows the real scale of the change.
What Is Relative Risk?
Relative risk compares the risk in one group with the risk in another group.
A simple example:
| Group | Risk |
|---|---|
| Group A | 2% |
| Group B | 1% |
Group A has twice the risk of Group B. That means the relative risk is 2, or a 100% increase.
Relative risk is useful because it shows comparison. But it does not show the full size of the risk. A risk can double and still remain small.
For example:
| Before | After | Relative Change |
|---|---|---|
| 1 in 10,000 | 2 in 10,000 | 100% increase |
The percentage sounds huge. The real-world difference is 1 extra case per 10,000 people.
What Is Absolute Risk?

Absolute risk shows the actual chance that something happens.
Instead of saying “risk doubles,” absolute risk asks:
How many people are actually affected?
Example:
| Situation | Absolute Risk |
|---|---|
| Before | 1 in 10,000 |
| After | 2 in 10,000 |
The absolute risk increased by 1 in 10,000.
Absolute risk is often easier to understand because it shows the real size of the outcome. It gives the denominator, the baseline, and the actual scale.
Relative Risk vs Absolute Risk: The Simple Difference
Relative risk tells you how much a risk changed compared with another risk.
Absolute risk tells you how big the risk actually is.
| Risk Before | Risk After | Relative Change | Absolute Change |
|---|---|---|---|
| 10% | 5% | 50% decrease | 5 percentage points |
| 2% | 1% | 50% decrease | 1 percentage point |
| 0.2% | 0.1% | 50% decrease | 0.1 percentage points |
| 1 in 10,000 | 2 in 10,000 | 100% increase | 1 extra case per 10,000 |
The relative change can look identical even when the absolute change is very different.
That is why both numbers matter.
Why Relative Risk Can Be Misleading

Relative risk can be misleading because it often hides the baseline.
A headline might say:
“Risk increases by 100%.”
But 100% of what?
If the risk goes from 1 case to 2 cases, that is a 100% increase. But the absolute increase is only 1 case.
This is one of the most common statistical tricks in news, advertising, health reporting, politics, and business dashboards.
Relative risk is not always wrong. It can be useful. The problem appears when it is shown alone. That is why relative risk vs absolute risk examples are useful for checking whether a claim is truly important or just framed to sound bigger.
When relative risk is reported without absolute risk, people may overestimate the importance of a result.
This is one of the most common misleading statistics examples because the number is true, but the context is missing.
12 Relative Risk vs Absolute Risk Examples That Show Why Baselines Matter
1. A Medicine That “Cuts Risk by 50%”
Imagine a hypothetical medicine claim:
“This treatment cuts the risk of a condition by 50%.”
That sounds powerful.
But the absolute numbers might look like this:
| Group | Risk |
|---|---|
| Without treatment | 2 in 10,000 |
| With treatment | 1 in 10,000 |
The relative risk reduction is 50%.
The absolute risk reduction is 1 in 10,000.
This does not mean the treatment is useless. It means the headline alone does not tell you enough.
Why It Misleads
A 50% reduction sounds large, but the real-world difference depends on the baseline risk.
What to Check
Look for the original risk, the new risk, the sample size, the timeframe, and whether the numbers are hypothetical or from a real study.
2. A Disease Headline That Says Risk “Doubles”
A headline says:
“People who do X double their risk of disease.”
That sounds alarming.
But the numbers could be:
| Group | Risk |
|---|---|
| Group A | 1% |
| Group B | 2% |
The relative risk doubled.
The absolute increase is 1 percentage point.
That difference may still matter, but the word “doubles” can make it feel much larger than it is.
Why It Misleads
People react emotionally to “double,” but they often miss the baseline.
What to Check
Ask whether the article gives the absolute risk in both groups.
3. A Supplement Claim About Reducing Illness Risk
A supplement ad says:
“Reduces illness risk by 40%.”
The claim may be based on numbers like:
| Group | Risk |
|---|---|
| Without supplement | 5% |
| With supplement | 3% |
The relative reduction is 40%.
The absolute reduction is 2 percentage points.
That is a very different impression.
Why It Misleads
The percentage sounds more impressive than the absolute change.
What to Check
Check whether the claim is based on a controlled study, a small sample, or marketing language.
4. A Safety Feature That Reduces Accidents by a Large Percentage
A company says:
“Our safety feature reduces accidents by 60%.”
The real numbers might be:
| Situation | Accidents |
|---|---|
| Before | 5 accidents |
| After | 2 accidents |
That is a 60% reduction.
But the absolute change is 3 accidents.
This could be meaningful. But without knowing the total number of users, vehicles, trips, or hours, it is incomplete.
Why It Misleads
A large percentage can hide a small number of total events.
What to Check
Ask for the denominator: 5 accidents out of how many?
5. A Marketing Claim About “300% More Effective”
A product says:
“300% more effective than before.”
That may mean:
| Version | Result |
|---|---|
| Old version | 1 successful result |
| New version | 4 successful results |
Going from 1 to 4 is a 300% increase.
But if the sample size is small, the claim may not mean much.
Why It Misleads
Large percentage increases are easy to create when the starting point is tiny.
What to Check
Look for the original number, sample size, testing method, and comparison group.
6. A Small Business Growth Claim
A founder says:
“Our revenue grew by 200% this year.”
That sounds like a major success story.
But the absolute numbers could be:
| Year | Revenue |
|---|---|
| Last year | $500 |
| This year | $1,500 |
That is real growth, but the business is still small.
Relative growth tells you speed. Absolute numbers tell you scale.
Why It Misleads
A huge growth percentage can make a small base look like a large business.
What to Check
Ask for total revenue, profit, customer count, and starting point.
7. An Investment Return Headline
A headline says:
“This stock jumped 100%.”
That sounds exciting.
But the stock may have moved from $0.50 to $1.00.
A 100% gain is real. But it does not tell you volatility, risk, liquidity, or the previous decline.
Relative returns can be especially misleading when the starting value is very low.
Why It Misleads
Percentage returns can hide the original price and the risk profile.
What to Check
Look at the full price history, not just the percentage gain.
8. A Political Claim About Crime Increasing by 100%
A politician says:
“Crime increased by 100% in this neighborhood.”
That sounds like a crisis.
But the absolute numbers could be:
| Period | Reported Cases |
|---|---|
| Last month | 2 |
| This month | 4 |
The relative increase is 100%.
The absolute increase is 2 cases.
That does not mean the increase should be ignored. But it needs context.
Why It Misleads
Rare events can produce huge percentage changes from small absolute movements.
What to Check
Ask for long-term trends, population size, category definitions, and reporting changes.
9. A School Performance Claim Based on Small Numbers
A school report says:
“The failure rate doubled.”
That sounds serious.
But the data might be:
| Year | Students Who Failed |
|---|---|
| Last year | 1 |
| This year | 2 |
The failure count doubled, but the absolute increase is one student.
The meaning depends on the total number of students.
Why It Misleads
Small sample sizes can produce dramatic relative changes.
What to Check
Ask for the total student count, the rate, and several years of data.
10. A Social Media Claim About Rare Side Effects
A social media post says:
“This side effect is 3 times more likely.”
That sounds frightening.
But the absolute risk might be:
| Group | Risk |
|---|---|
| Group A | 1 in 100,000 |
| Group B | 3 in 100,000 |
The relative risk is 3 times higher.
The absolute difference is 2 extra cases per 100,000.
This is not medical advice. It is a hypothetical example showing why rare risks need careful communication.
Why It Misleads
“Three times higher” sounds huge, even when the event remains rare.
What to Check
Look for absolute risk, comparison group, timeframe, and trusted medical sources.
11. An Insurance Claim About Reduced Risk
An insurance company says:
“Customers using our device reduce risk by 30%.”
The absolute numbers might be:
| Group | Claim Rate |
|---|---|
| Without device | 10% |
| With device | 7% |
The relative reduction is 30%.
The absolute reduction is 3 percentage points.
Both numbers are useful. But the relative number sounds more impressive.
Why It Misleads
The relative claim emphasizes improvement while hiding the starting risk.
What to Check
Ask whether the groups are comparable and whether other factors explain the difference.
12. A Website Conversion Rate Improvement Claim
A marketing case study says:
“Conversions increased by 150%.”
That sounds like a breakthrough.
The numbers might be:
| Version | Conversion Rate |
|---|---|
| Old page | 2% |
| New page | 5% |
The relative increase is 150%.
The absolute increase is 3 percentage points.
That may be a great result, but only if the traffic volume and test quality are strong.
Why It Misleads
A big percentage can hide small traffic, weak testing, or short timeframes.
What to Check
Ask for traffic volume, test duration, confidence level, and absolute conversions.
Relative Risk vs Absolute Risk in Health News
Health headlines often use relative risk because it sounds dramatic.
These relative risk vs absolute risk examples are especially important in health news because a small baseline can make a large percentage look urgent.
A “50% reduction” is more clickable than “risk fell from 2 in 10,000 to 1 in 10,000.”
This is why health statistics examples should be read carefully. The same result can feel huge or small depending on how it is framed.
Good health reporting should show:
- baseline risk
- absolute risk
- relative risk
- sample size
- timeframe
- limitations
When the article only gives the relative number, the reader is missing the most important context.
Many examples of misleading news use dramatic percentages without showing the absolute risk behind the headline.
Clear risk communication should report relative and absolute risks together instead of relying on relative risk alone.
Relative Risk vs Absolute Risk Examples in Advertising
Advertising often uses phrases like:
- “twice as effective”
- “300% improvement”
- “50% fewer problems”
- “3 times better results”
These claims may be true in a narrow sense. But they can still be misleading if the baseline is hidden.
For example, “300% more effective” could mean going from 1 success to 4 successes.
That is why advertising claims should always be checked against absolute numbers.
Relative Risk vs Absolute Risk vs Percentage Points

A percentage change and a percentage point change are not the same thing.
Example:
| Before | After |
|---|---|
| 10% | 15% |
The absolute increase is 5 percentage points.
The relative increase is 50%.
Why?
Because 15% is 50% higher than 10%.
This distinction matters because people often confuse percentage points with percent change.
If unemployment rises from 4% to 5%, it increased by 1 percentage point. It did not increase by 1%.
The relative increase is 25%.
Common Warning Signs in Relative Risk vs Absolute Risk Examples
When reading relative risk vs absolute risk examples, the main warning sign is a percentage with no baseline.
Be careful when a claim includes:
- no baseline
- only percentages
- tiny sample size
- no timeframe
- no comparison group
- emotional headline
- vague wording
- missing denominator
- no absolute numbers
- no explanation of who was studied
The more dramatic the percentage, the more important the baseline becomes.
Missing baselines are also common in misleading data examples, especially when percentages are shown without denominators.
How to Spot Misleading Relative Risk Claims

Use this checklist:
- Ask “50% of what?”
- Find the baseline risk.
- Calculate the absolute difference.
- Look for the sample size.
- Check the timeframe.
- Compare with independent sources.
- Look for natural frequencies, such as “1 in 1,000.”
- Ask whether the groups are truly comparable.
- Watch for emotional wording.
- Check whether the claim is from a study, ad, headline, or opinion post.
A strong claim should survive basic context checks.
Risk claims can also be confused with correlation vs causation examples when people assume one factor directly caused the outcome.
How to Avoid Misleading People With Risk Statistics
If you write about risk, show both numbers.
Better communication looks like this:
“The risk fell from 4% to 2%, which is a 2 percentage point absolute reduction and a 50% relative reduction.”
This is clearer than:
“The risk was cut by 50%.”
To avoid misleading readers:
- show both relative and absolute risk
- include baseline numbers
- use natural frequencies
- avoid emotional wording
- explain limitations
- show the denominator
- include the timeframe
- make comparisons fair
Risk communication should help people understand, not just react.
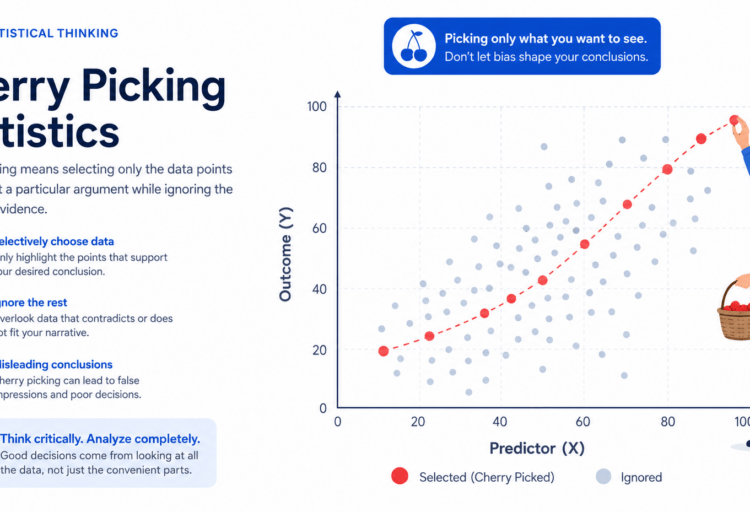
Relative risk can become even more misleading when it is combined with cherry picking statistics examples.
Cochrane research suggests that natural frequencies can help people understand risk more clearly than percentages alone.
Why People Fall for Relative Risk Claims
People fall for relative risk claims because large percentages feel important.
A “100% increase” sounds urgent. A “1 in 10,000 increase” sounds less dramatic.
The same data can create different emotional reactions depending on the framing.
People also fall for these claims because:
- headlines reward drama
- absolute numbers are less exciting
- baselines require more thinking
- risk is emotional
- percentages feel scientific
- small denominators are easy to ignore
This is why relative risk vs absolute risk examples are so useful. They train you to look past the headline.
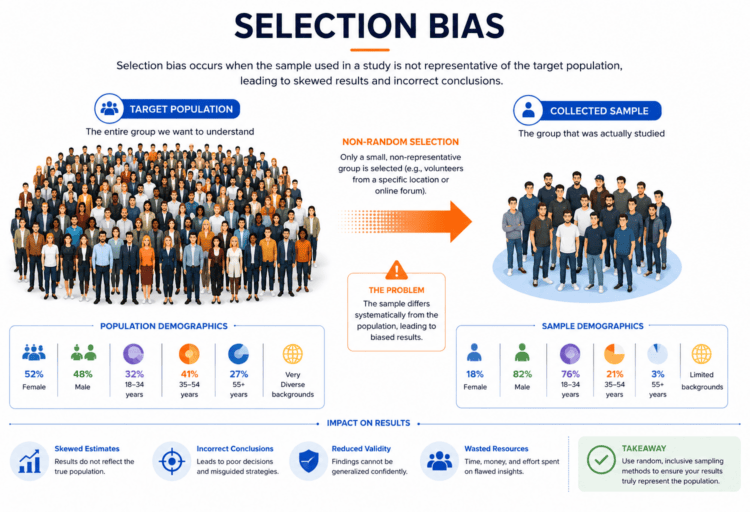
Some risk claims also depend on selection bias examples, especially when the comparison groups are not truly comparable.
Recommended Books on Statistics and Risk Thinking
These books can help readers understand misleading statistics, risk communication, and critical thinking.
- How to Lie with Statistics
A short classic on how numbers can be framed to mislead people. - The Art of Statistics
A clear introduction to statistical thinking, uncertainty, and data interpretation. - Thinking, Fast and Slow
A useful book for understanding why people react emotionally to risk, probability, and framing.
FAQ
What Is Relative Risk?
Relative risk compares the risk in one group with the risk in another group. It shows how much higher or lower one risk is compared with another.
NCBI Bookshelf explains relative risk as a comparison between the probability of an event in one group and the probability of that event in another group.
What Is Absolute Risk?
Absolute risk shows the actual chance that something happens. It gives the real size of the risk, usually as a percentage or natural frequency.
The National Cancer Institute defines absolute risk as the likelihood that a specific event happens over a certain period of time
What Is the Difference Between Relative Risk and Absolute Risk?
Relative risk compares two risks. Absolute risk shows the actual probability of the event. Relative risk can sound dramatic when the baseline risk is small.
What Is a Simple Example of Relative Risk vs Absolute Risk?
If a risk falls from 2% to 1%, the relative risk reduction is 50%. The absolute risk reduction is 1 percentage point.
Why Can Relative Risk Be Misleading?
Relative risk can be misleading because it often hides the baseline. A risk can double while still remaining very small in absolute terms.
Why Is Absolute Risk Important?
Absolute risk is important because it shows the real-world size of the risk. It helps people understand how many people are actually affected.
What Does “Risk Doubled” Really Mean?
“Risk doubled” means the risk became twice as large compared with the original risk. But it does not tell you whether the risk went from 1% to 2% or from 30% to 60%.
What Is the Difference Between Absolute Risk and Percentage Points?
Absolute risk shows the actual probability. A percentage point change shows the direct difference between two percentages. For example, going from 10% to 15% is a 5 percentage point increase.
How Do You Spot Misleading Risk Statistics?
Look for missing baselines, missing denominators, only percentages, tiny samples, emotional headlines, and no absolute numbers.
Should News Articles Report Both Relative and Absolute Risk?
Yes. Reporting both relative and absolute risk gives readers a clearer and more balanced view of the data.
Conclusion
Relative risk vs absolute risk examples show why percentages can be useful, persuasive, and misleading at the same time.
A claim like “risk doubled” or “risk dropped by 50%” may be technically true. But without the baseline, the sample size, and the absolute numbers, it can create the wrong impression.
This is one of the most common patterns in misleading statistics, misleading percentages, advertising claims, health headlines, business dashboards, and political messaging.
Relative risk tells you how much something changed compared with another number. Absolute risk tells you how much actually changed in the real world.
Before reacting to a percentage, always ask: percentage of what?