Introduction
Examples of misleading news are everywhere. Every day, millions of people consume news articles that appear factual but actually distort reality through misleading statistics, selective data, or manipulated graphs.
Many readers trust news sources without questioning the data behind them. However, these examples of misleading news show how easily information can be presented in a way that misleads the public.
In this article, you’ll discover real examples of misleading news, understand how media manipulation works, and learn how to identify misleading information instantly.
Research from Pew Research Center shows that people are strongly influenced by how information is presented in the media.
Free PDF: Learn to Spot Misleading Statistics
Learn how to spot cherry picking, biased samples, misleading graphs, fake precision, and other common data tricks.
Download the free guide below.
Types of Misleading News (With Examples)
Before diving into real examples of misleading news, it’s important to understand the most common techniques used in media.
1. Cherry-Picked Data
Only showing data that supports a specific narrative.
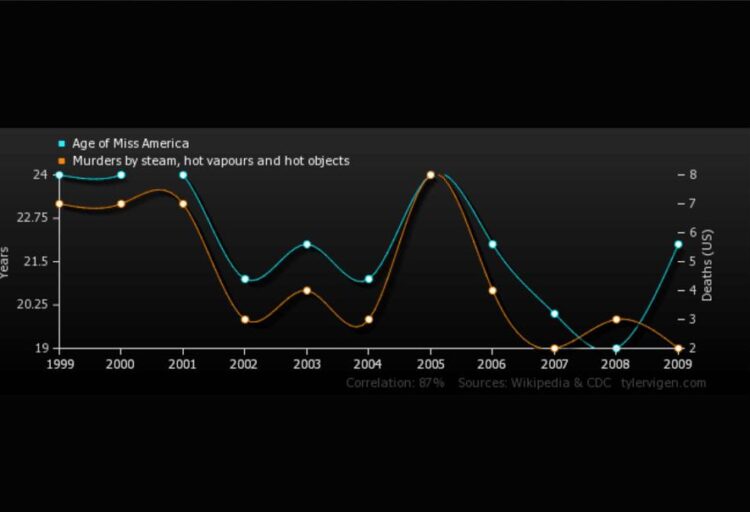
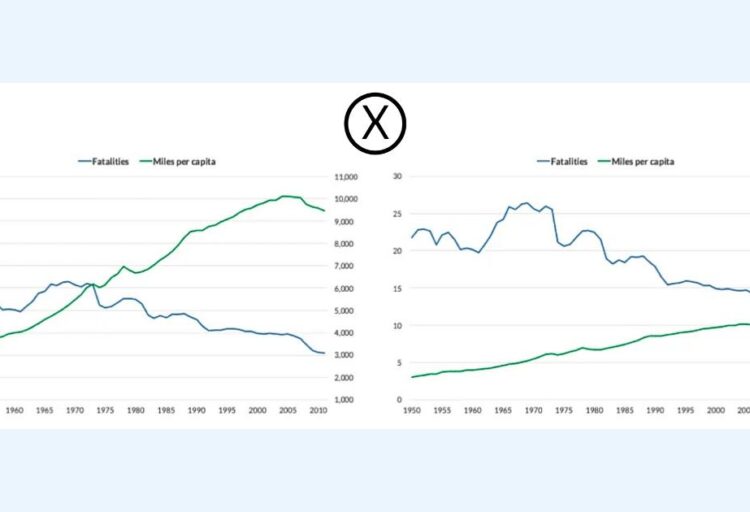
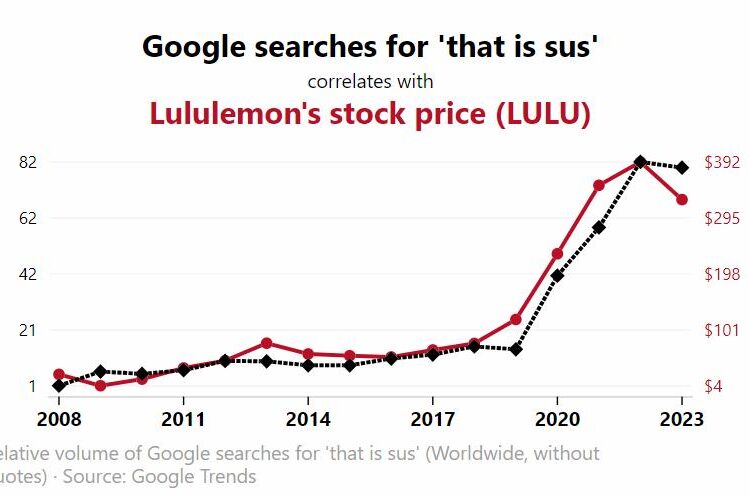
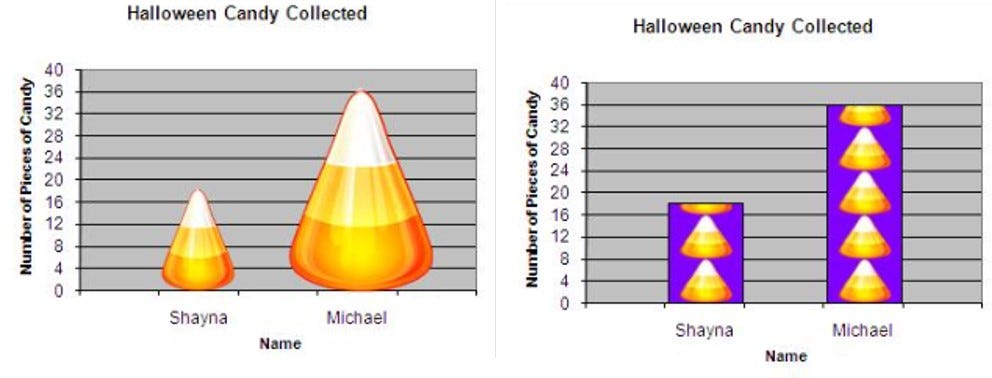
2. Misleading Graphs
Using distorted visuals to exaggerate trends.
3. Lack of Context
Presenting numbers without proper comparison.
4. Misleading Percentages
Using percentages instead of absolute numbers.
5. Sensational Headlines
Headlines that exaggerate or misrepresent data.
These techniques appear in many examples of misleading news and can significantly influence public perception.
A detailed breakdown of misleading data techniques is available on Data to Viz.
15 Examples of Misleading News That Fooled Millions
1. Crime Rate “Spike” Headlines
News outlets reported a “huge increase” in crime, but the graph used a truncated y-axis, making a small increase look dramatic.
2. Health Risk Percentages

A study claimed a “50% increase in risk,” but the actual change was from 2% to 3%.
3. Economic Growth Misrepresentation
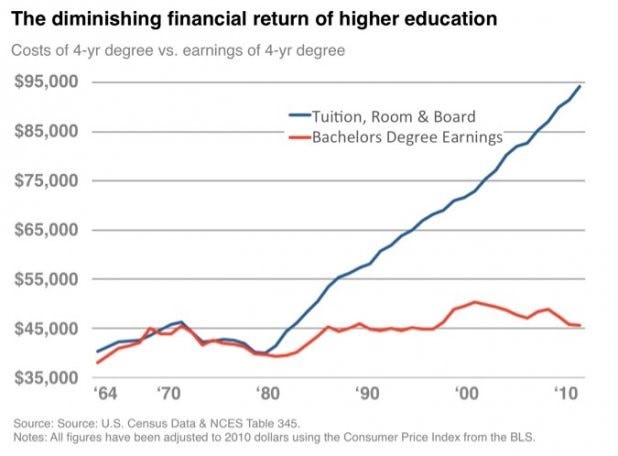
News articles highlighted short-term growth while ignoring long-term decline.
4. Climate Change Timeframe Selection
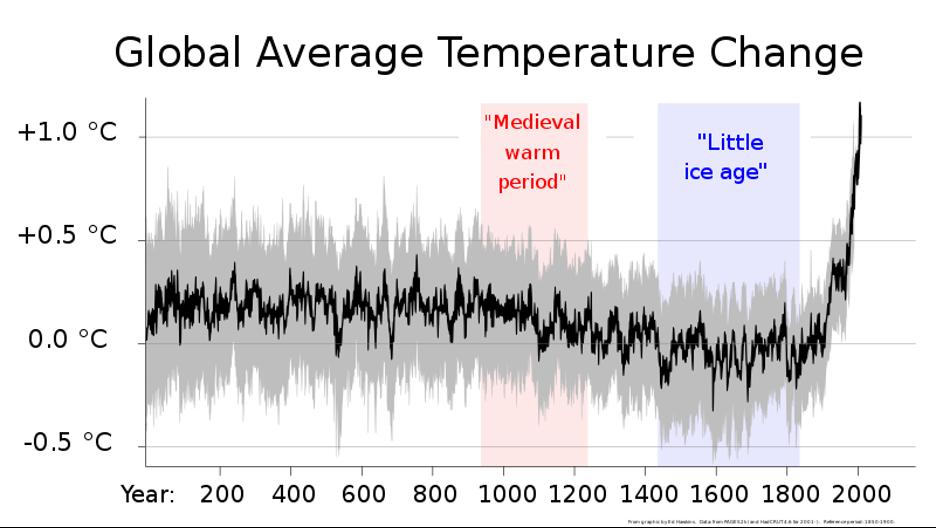
Selective years were used to suggest climate trends were stable.
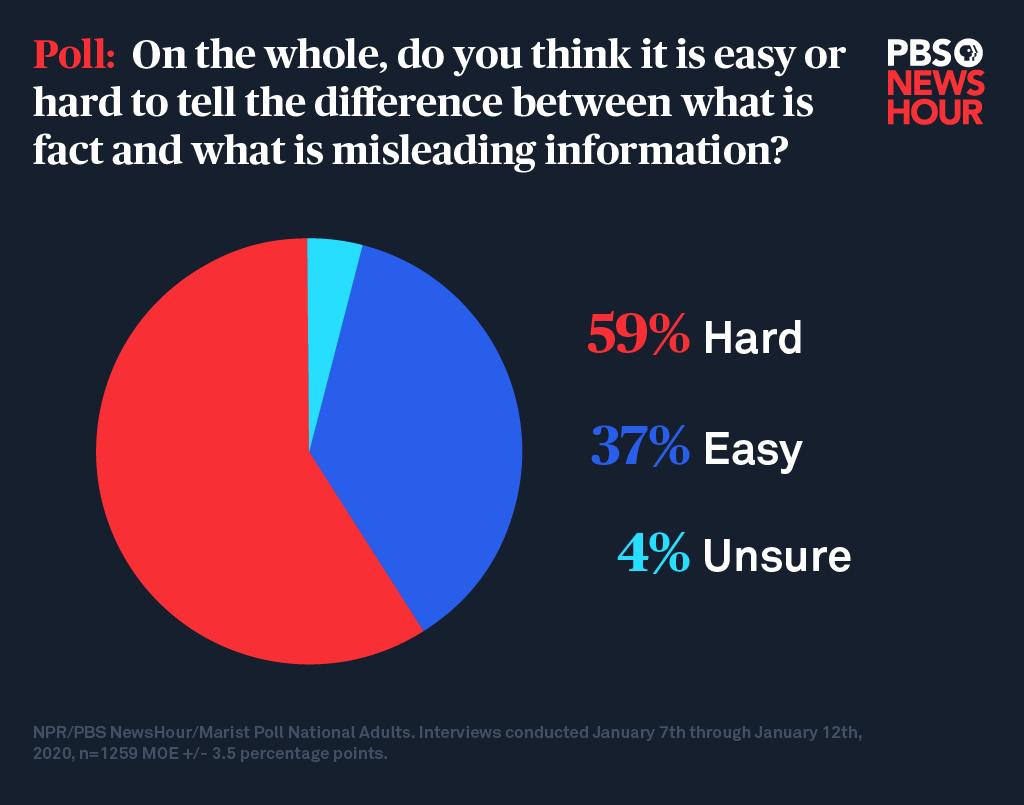
5. Survey Results Without Context
Poll results were shown without explaining sample size or bias.
6. Gun Death Graph Distortion
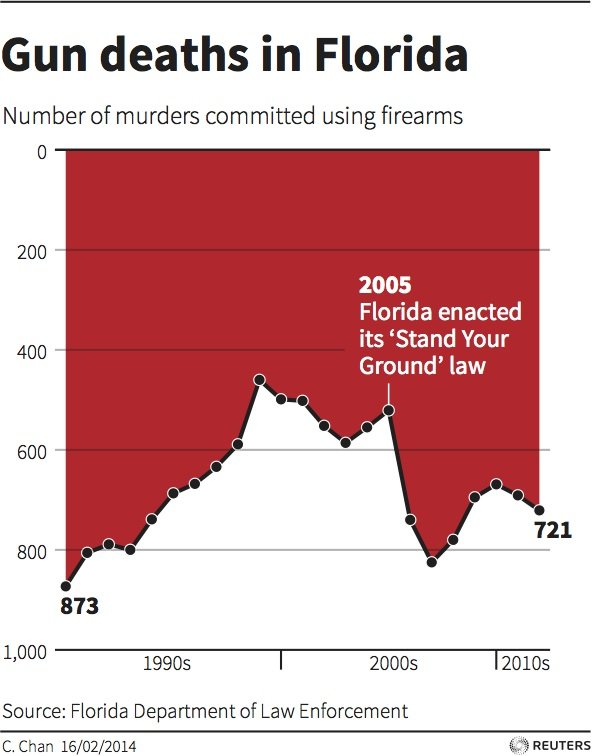
A widely shared chart used a truncated and inverted y-axis, hiding the real trend and misleading readers.
7. Employment Statistics Confusion
Unemployment rates were presented without including underemployment.
8. Education Rankings Misuse
Rankings changed due to methodology, not actual performance.
9. COVID Case Comparisons
Countries were compared without adjusting for population size.
10. Stock Market Headlines
Short-term fluctuations presented as long-term trends.
Many examples of misleading news are based on real-world datasets published by platforms like Statista.
11. Inflation Reporting Tricks
Nominal values were used instead of real inflation-adjusted numbers.
12. Misleading Averages
Averages were used instead of medians, distorting income data.
13. Social Media “Viral Trends”
Small datasets presented as global trends.
14. Product Comparison Bias
Only favorable data points were included in comparisons.
15. Political Poll Manipulation
Polls were selected based on favorable outcomes.
Why Misleading News Is So Effective
Examples of misleading news work because:
- People trust authoritative sources
- Visual data is rarely questioned
- Context is often ignored
- Headlines influence perception more than content
This is why misleading news spreads quickly and influences millions.
How to Identify Misleading News
To detect examples of misleading news, check:
1. The Source
Is it credible and transparent?
2. The Data
Is the full dataset shown?
3. The Graph
Are axes and scales manipulated?
4. The Context
Are comparisons fair?
5. The Language
Is it emotional or neutral?
Educational platforms such as Khan Academy explain how data interpretation errors occur.
Misleading News vs Misleading Graphs
Many examples of misleading news rely on misleading graphs. If you want to understand how charts are manipulated, read:
👉 https://empirestats.net/2026/03/26/misleading-graphs-examples/
Recommended Resources
If you want to better understand misleading news and data:
- Books on statistics and cognitive bias
- Data visualization guides
- Online courses on data analysis
You can explore beginner-friendly resources on Amazon or take practical courses on Udemy.
FAQ
What are examples of misleading news?
Examples of misleading news are articles or reports that distort reality using selective data, misleading graphs, or lack of context.
Why is news misleading?
News can be misleading due to bias, poor data interpretation, or intentional manipulation to influence public opinion.
How can you spot misleading news?
You can identify misleading news by checking sources, analyzing data, and questioning graphs and statistics.
Conclusion
Examples of misleading news are more common than most people realize. By understanding how data can be manipulated and learning to question what you read, you can avoid being misled.
The next time you see a shocking headline or dramatic statistic, take a closer look — the reality may be very different from what it seems.
You can explore real-world data and verify trends using sources like Our World in Data.
🔗 Internal links
If you found these examples of misleading news interesting, explore related analyses:
👉 25 Misleading Graphs Examples That Fooled Millions (Shocking Real Cases)
👉 Misleading Statistics Examples: 15 Real Cases That Prove How Data Can Lie